1. Introduction
Electrification in the transportation sector continues to increase along with the need for green technology. Several countries have made plans and calculations about the impact of electrification in the transportation sector (Brown et al., 2020; Holland et al., 2021; Liang et al., 2019; Mahady et al., 2020; Talebian et al., 2018). Regulations and incentives have been created so that the electrification targets can be quickly achieved. This encourages research and development of transportation technology, especially electric vehicles, to innovate soon (Amin et al., 2021; Budiman et al., 2021; Feng & Magee, 2020; Huda et al., 2020). However, there are still many challenges in electric vehicles and the development of their components. One of the development challenges is the battery pack. A typical battery pack consists of battery cells, a battery management system, connectors, fuses, a battery box, and wiring. A battery box is usually made from metal, such as mild steel (Yang et al., 2019), stainless steel (Masurkar et al., 2018), or aluminum alloy (Chen et al., 2017), which acts as a container and also as a flame barrier. The strength of the battery box structure is designed to support the weight of the battery cells and other components in it. The study of collision scenarios that impact the structure and damage to the battery box was carried out (Qiao, Yu, et al., 2021; Qiao, Zhanxi, et al., 2021; Ruan et al., 2021). Moreover, a battery box protects the external environment from the thermal runaway of the battery cells. The thermal runaway can occur due to over-current, over-voltage, and overcharge (Gao et al., 2022). At the same time, it also protects the battery cells from thermal exposure or flame from the external environment as mentioned in ISO 12405-3 standard (Darnikowski & Mieloszyk, 2021). When a vehicle accident causes a fire, the surrounding temperature may be higher than the internal temperature of the battery box. As a result, the battery cells become exposed so that the temperature increases. At extreme levels, this may lead to material decomposition in the battery cell (Kotak et al., 2021) and cause an internal short circuit or thermal runaway (Bisschop et al., 2019).
The additional battery capacity requires more material for the battery box, thus increasing the vehicle curb weight. Components that cause an increase in such curb weight are undesirable in designing a vehicle (Liu et al., 2020). Heavy vehicles require more energy than light vehicles (Nandhakumar et al., 2021). Specifically for electric vehicles, the high or low curb weight can influence the vehicle mileage on each battery charged (Kumar & Bharj, 2021). As an alternative, metal can be replaced with non-metallic materials but with the same function to achieve the goal of lightweight vehicles (Liu et al., 2018). The most popular non-metallic material is a polymer (Mutlu et al., 2021). Thermoplastic polymers have a high potential for use in the automotive industry (Elmarakbi, 2014). The polymer can be combined with reinforcement to form a structure with a specific strength called polymer composites. In addition to being lightweight, some of the superior characteristics are the high strength, corrosion resistance, and fatigue resistance obtained from fiber-reinforced polymer (Xian et al., 2022). Glass fiber-reinforced polymer is an example of such a composite. Applying polymer composites to vehicle components can improve vehicle efficiency in the form of lower energy consumption (Wu et al., 2018). Reduction in the emission is the other advantage that can be obtained (Xian et al., 2022).
In this study, the polymer used as the base material for the battery box is unsaturated polyester (UP) resin. Polyester is widely used in composite products because it has good mechanical properties, resistant to weather changes, and is economical (Mouritz & Gibson, 2006). UP is a typical thermosetting polymer widely used in the composite industry in aerospace, automotive, transportation, and other fields because of its low viscosity and easy processing (Gao et al., 2020). Due to a viscous material, UP shows the potential that can be applied to various fabrication processes (Blanco et al., 2021), including hand lay-ups and spray lay-ups. Furthermore, another potential application of this material is to use it as a base material for thermal conductivity in the renewable energy fields (Bing et al., 2021). However, UP has an undesirable property when applied to a battery box, which is flammable. UP is a highly flammable material that produces toxic gas and releases lots of heat when decomposed (Chu et al., 2021). One of the solutions to this issue is adding flame retardant fillers, such as aluminum tri-hydroxide (ATH) (Zhang et al., 2021). ATH undergoes endothermic decomposition starting at 220°C and produces an enthalpy of water release of 1.17 kJ/g (Horrocks & Price, 2001). ATH decomposes to produce alumina (Al2O3) and water (H2O). Alumina is a flame retardant that forms a barrier after ATH decomposition, while water dissolves combustible materials causing a decrease in fire reactivity (Visakh & Yoshihiko, 2015). The addition of ATH into UP can increase ignition time, reduce carbon monoxide gas yield, and decrease peak heat release rate, hence increasing the level of safety (Chai et al., 2019; Hapuarachchi & Peijs, 2009). UP with an ATH composition of 60wt% can produce flame retardancy according to UL-94 V0 (Colpankan et al., 2018). Even UP with nanosized ATH particles produce higher flame retardancy than micro-sized ones (Elbasuney, 2017). The negative impact that arises from ATH concentration in the UP is a decrease in the mechanical properties of the composite. When the ATH composition is more than 10wt%, the tensile strength of the UP composite is lower than the neat UP (Zhao et al., 2010). Likewise, the flexural strength also tends to decrease along with the increase in ATH (Kaleg et al., 2018). The increase of filler content causes a reduction of the ultimate tensile strength of the composites due to the lack of polymer (Bleach et al., 2002). Even when added with reinforcement fiber, the combination of UP and ATH still decreases flexural strength (Kaleg et al., 2022). The mechanical properties degradation of the UP with ATH for battery boxes needs to be re-evaluated due to the vehicle will operate dynamically because of acceleration, deceleration, and road surface that produce vibrations in the structure. The mass of battery cells can provide static and dynamic loads on the battery box. These operating conditions cause the combination of UP and ATH may not be appropriate as a battery box material.
ATH can be combined with other fillers as a hybrid in the UP to reduce the degradation of mechanical properties. The combination with a reinforcement powder may improve mechanical properties and flame retardancy optimally (Bhaskar et al., 2020), even though this powder comes from synthetic or natural materials (Chandramohan & Kumar, 2017). Silicon carbide, aluminum oxide, Calcium carbonate, Boron carbide, Zinc oxide, and Graphite are some synthetic powders that can improve the mechanical properties of polymer composites (Praveenkumara et al., 2021). Rice husk, coconut shell filler, egg shells filler, fish bone and fish scale filler, peanut and groundnut shell powder, and wood sawdust are natural materials that have the advantages of abundant availability, biodegradable, inexpensive, low specific density, non-toxic, and environmentally friendly (Jagadeesh et al., 2020).
The solution proposed in this study is to combine ATH and short glass fiber (G). Filler G is a powder material usually used in industry to increase the strength of polymer composites. The G of up to 20% to the UP can increase the composite flexural strength by 56% and tensile strength by 15% more than neat ones (Mubeen et al., 2019). Hybrid fillers between porcelain powder and glass powder can increase the compressive strength and modulus of elasticity of the epoxy composites (Salih et al., 2018). A specific composition between UP, ATH, and G will produce an optimal balance of flame retardancy and mechanical strength. An experimental study was carried out to characterize several samples of UP composites with variations of ATH and G. This paper describes the experiments starting from the materials used, the composites characterization, and discussions regarding the results and observations.
2. Materials and methods
2.1. Materials
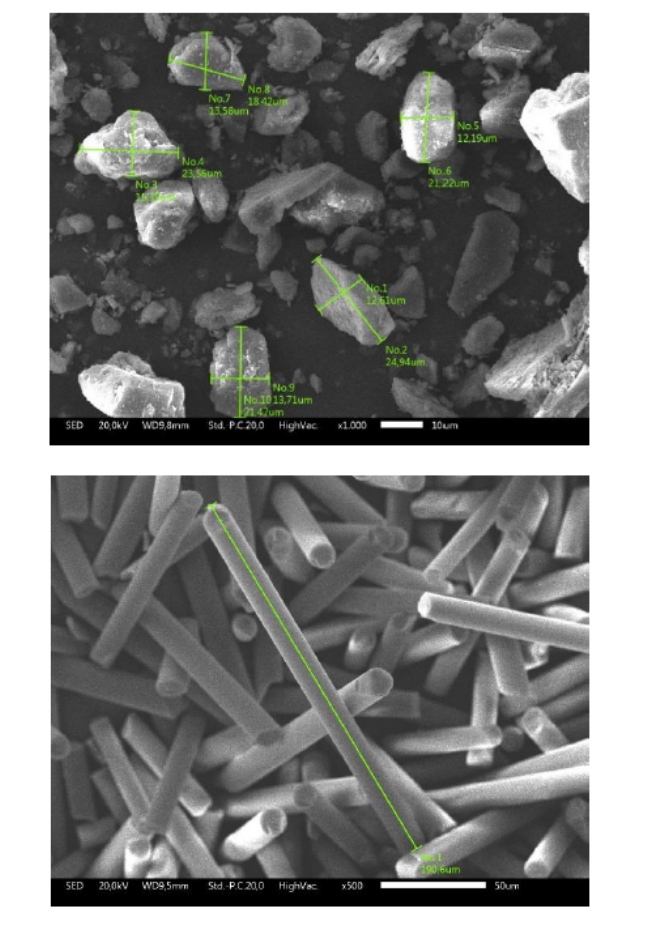
The polymer material in this study is unsaturated polyester (UP) mixed with aluminum tri-hydroxide (ATH) and short glass fiber (G) as the fillers. The UP used is an orthophthalic, thixotropic, pre-accelerated, and non-waxed resin manufactured by Justus Kimiaraya with the brand name Yukalac 157 BQTN-EX. The methyl ethyl ketone peroxide (MEKP) is a solution that triggers the cure reaction process of the UP composites, supplied by Justus Kimiaraya with the brand name MEPOXE. Technical grade ATH was a flame retardant obtained from ROFA laboratory center with the product code of RLC2.0008.1000. This ATH filler has a material density of 2.42 g/mL and a purity of more than 95%. Filler G as the composite reinforcement is a silica-rich micro-sized fiber material obtained from Justus Kimiaraya with the product name of Glassron powder. Figure 1 shows the morphology and grain size of the ATH and G particles. ATH particles are predominantly oval with a length of about 18 to 24 μm and a width of about 12 to 15 μm. Irregular ATH particles were observed because of the absence of a sieving process for ATH preparation. G particles form and size are cylindrical rods with a diameter of about 12 μm and a length of about 100 to 500 μm.
2.2. Samples preparation
Table 1 presents the weight percentage of neat UP and UP composite samples. The composite materials were mixed in a high-speed mechanical mixer to increase the dispersion of the filler into the resin. The UP and the fillers were stirred at 3,000 rpm for 5 minutes (Hapuarachchi & Peijs, 2009). The matrix (already mixed materials) was stored until the trapped bubbles during the mixing process were visually released. Next, MEKP as much as 1wt% of UP was added into the matrix and stirred slowly until evenly blended. The matrix was poured into an open mold to produce samples. The matrix was stored at room temperature for 24 hours for the slow curing process. Finally, the samples were released from the mold and then put into an oven with circulated air for a post-curing process for 60 minutes at 100 ºC (Diharjo et al., 2013).
2.3. Characterization
The characterization of flame retardancy and mechanical properties is implemented in all the composite samples (following Table 1). Flame retardancy was measured through thermal properties, thermal stability analysis, and burning properties. Furthermore, the mechanical properties were measured through tensile strength, bending strength, and observation of the fracture surface morphology. Thermal properties were investigated by measuring the endothermic peak temperature of the samples. The endothermic temperature was measured using the differential scanning calorimetry (DSC) of NETZSCH DSC 214 Polyma. The DSC temperature range was from 30 to 180 ºC at a heating rate of 4 ºC/min. The thermal stability properties of samples were investigated using thermogravimetric analysis (TGA) utilizing NETZSCH TG 209 F1 Libra. The TGA temperature range was from 25 to 600 ºC at a heating rate of 20 ºC/min and under an N2 atmosphere (the flow rate is 20 mL/min). The burning properties were examined according to the ASTM D 635 standard. The test data is in the form of the burning rate (V in mm/min) calculated from the burning time (t in min) and burning length (L in mm), which refers to a formula in (1).
The strength of materials tests was applied to the samples to analyze the effect of adding ATH and G into UP. The tensile and bending strength were measured using a universal testing machine of the Tensilon UCT series. The crosshead speed of tensile and bending strength tests was 10 mm/min and 2 mm/min, respectively. The tensile and bending samples were characterized according to the ASTM D 638 and ASTM D 790 standards, respectively. The fracture surface of the samples was observed using scanning electron microscopy (SEM) of JEOL JSM-IT300.
3. Results and discussion
3.1. Thermal properties
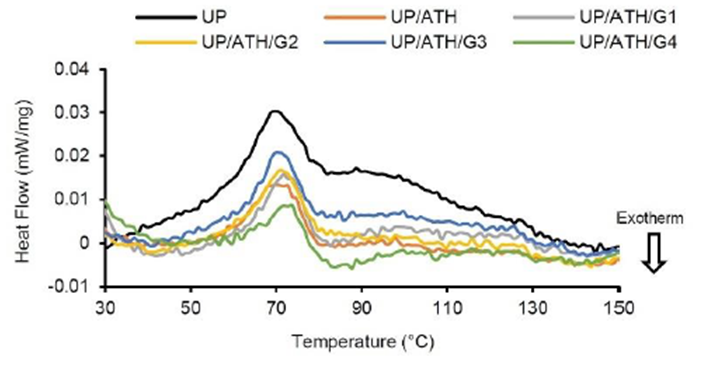
The DSC thermograms of the samples are depicted in Figure 2. The maximum endothermic temperature is shown from the peaks on the heat flow curve. The DSC results show that the maximum endothermic for each sample occurs at a temperature of around 70 °C by the nature of the thermoset material, which has a visible glass transition effect (Salasinska et al., 2020). The same results were also shown in a study on epoxy resins with flame retardant ATH (Budd & Cree, 2019). Table 2 shows that the samples with the addition of G had a higher maximum endotherm temperature than UP and UP/ATH. The UP/ATH/G4 shows the highest maximum endotherm temperature with an increase of 2.7 °C to the UP. The addition of G by 8wt% influences this result since the main compositions of filler G are Si, Ca, and Al. These elements are heat absorbents that work to reduce the rate of thermal distribution to an extended area. Silica (SiO2) can slow down the polymer decomposition rate, but a significant effect appears at a temperature of 250 to 500 °C (Wang et al., 2013). The addition of alumina (Al2O3) content can increase the glass transition temperature due to increasing endothermic reactions (Chen et al., 2022). These results prove that filler G acts as a heat sink in the UP resin. Silica can significantly reduce the peak heat release rate of polymer materials (Członka et al., 2020). The UP/ATH shows a slight increase in maximum endotherm temperature of 0.8°C to the UP. The ATH also functions as a heat sink in the UP resin (Elbasuney, 2017; Hapuarachchi & Peijs, 2009). Another study showed that the addition of ATH did not modify the melting point temperature of polymer composites (Chang et al., 2014). However, ATH can withstand composite degradation to higher temperatures than without metal hydroxides (Fredi et al., 2019). The heat sink effect is beneficial to the function of the battery box components. Certain shapes and materials can produce a more efficient thermal conductivity as a heat sink (Akula & Balaji, 2022). This heat sink effect causes heat exposure from outside the battery box retained before reaching the battery cell assembly. On the other hand, the fire hazard that may be caused by the thermal runaway of the battery cells can be restrained by the battery box material to provide sufficient evacuation time for people around the vehicle.
3.2. Thermal stability analysis
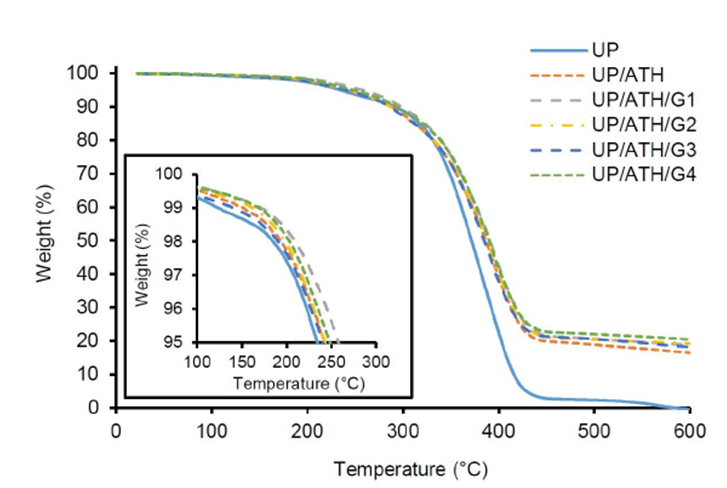
The degradation of weight due to temperature is discussed in three stages in the form of the temperature at 95% weight (T95), the temperature at weight 50% (T50), and the temperature at the maximum value of the derivative of weight (Tmax). Furthermore, the final weight at a temperature of 600 °C (FW) and the maximum rate of weight degradation (DTGmax) strengthen the thermal stability discussion. Figure 3 shows the TGA thermogram for each sample and is clarified by the TGA and DTG data in Table 3. When T95 occurs, the inset in the TGA results shows that the samples added with ATH and G fillers have a higher temperature than the neat UP. The UP/ATH/G1 shows the highest temperature at a 95% weight of 258 °C.
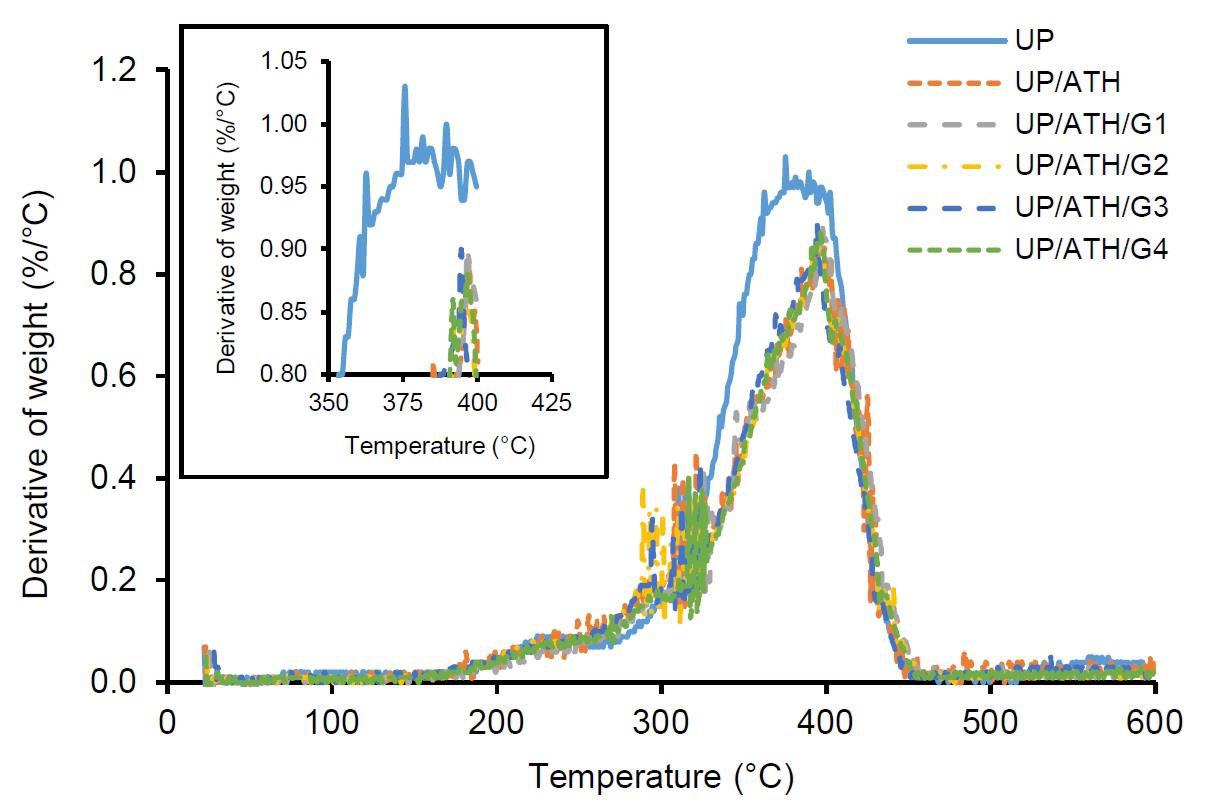
In T50, the samples with the ATH and G fillers can maintain the weight better than neat UP. The UP/ATH/G1 has the highest temperature at 391 °C or about 5% higher than the neat UP. The maximum temperature value of the derivative of weight is used to analyze the temperature of the samples when they are at the highest weight degradation rate. The UP/ATH/G1 has the highest temperature in the highest weight degradation rate at 397.4 °C. The samples with ATH and G fillers leave about 16.5% to 20.5% residue at a temperature of 600 °C, which is in the form of char yield. ATH and G show better char-forming ability than neat UP (Tang et al., 2019). However, the samples with the addition of G showed more char yield than samples that only used ATH. The ATH decomposition produces alumina (Al2O3) and water. Alumina has a lighter density than glass material (rich in Si). Char formed at high temperatures indicates an increase in the thermal stability of the polymer composite (Wang et al., 2003). The maximum rate of weight degradation is shown in Figure 4 and the value of DTGmax is in Table 3. In general, the addition of ATH and G fillers can reduce the rate of weight degradation due to a temperature of around 0.1%/°C. The samples with the addition of filler showed a slower rate of weight degradation compared to the neat material. The results prove that ATH and G can maintain the stability of UP by being degraded at higher temperatures (Suoware et al., 2019). The increase in UP stability is caused by the barrier effect of the active filler when the material decomposes due to thermal (Tibiletti et al., 2011). Based on this thermal stability analysis, a battery box can be developed from UP by adding ATH and G fillers according to the composition of UP/ATH/G1. The advantage obtained is a box with better resistance to heat exposure.
Table 3 TGA and DTG data of samples.
| Sample | T95 1) (°C) | T50 2) (°C) | Tmax 3) (°C) | FW 4) (%) | DTGmax 5) (%/°C) |
| UP | 234 | 372 | 377.8 | 0.0 | 1.03 |
| UP/ATH | 242 | 386 | 394.6 | 16.5 | 0.89 |
| UP/ATH/G1 | 258 | 391 | 397.4 | 18.8 | 0.90 |
| UP/ATH/G2 | 242 | 387 | 394.8 | 19.3 | 0.85 |
| UP/ATH/G3 | 240 | 384 | 393.6 | 18.3 | 0.90 |
| UP/ATH/G4 | 248 | 390 | 395.3 | 20.5 | 0.88 |
1) T95 is the temperature at 95% weight.
2) T50 is the temperature at 50% weight.
3) Tmax is temperature derivative of weight.
4) FW is the final weight temperature of 600 oC.
5) DTGmax is the derivative of weight.
3.3. Burning properties
According to Table 4, the samples with additional ATH and G fillers produced a lower burning rate than neat UP. The UP/ATH is the sample with the highest ATH composition resulting in the lowest burning rate of 6.9 mm/min, or 53% lower than neat UP. Adding ATH to the UP can reduce the value of the burning rate, which means an increase in flame retardancy. The 60wt% of ATH in the UP results in a composite that self-extinguished when burned (Kaleg et al., 2022). Several other studies showing a similar trend that increasing ATH concentrations can reduce the burning rate were found in polyvinyl alcohol (Ameer & Habbeb, 2017) and bio-based polyurethane foam (Silva et al., 2021), while another one shows the flaming combustion is also self-extinguished (Halim et al., 2020; Marques et al., 2018). The mechanism of ATH during decomposition was endothermic dehydration by releasing water vapor and forming alumina formation (Hapuarachchi & Peijs, 2009). The formation of alumina in the polymer decomposition process makes air and fuel difficult to mix, which is a component of a fire.
Table 4 Burning rate data of the samples.
| Sample | Burning rate (mm/min) | Standard deviation |
| UP | 14.9 | 0.4 |
| UP/ATH | 6.9 | 0.2 |
| UP/ATH/G1 | 8.4 | 0.4 |
| UP/ATH/G2 | 8.5 | 0.3 |
| UP/ATH/G3 | 8.6 | 0.3 |
| UP/ATH/G4 | 9.2 | 0.2 |
Samples that added filler G showed an increase in the burning rate probably caused by the ATH reduction. However, samples with filler G still produced a lower burning rate than neat UP. Filler G consists of an oxide material with a predominance of silica (SiO2). Silica will form a silica barrier when polymer decomposition occurs. As a similar mechanism to alumina, this formation hinders the mixing of air and fuel. The disadvantage of G over ATH is it does not have a hydroxyl group that can dehydrate when exposed to fire. Therefore, the flame retardancy of ATH is better than that of G. Another drawback is the possible shape and size of the particles of G, which are relatively larger than ATH. The cylindrical shape, like a rod, may cause the imperfect formation of the barrier. However, all samples added with filler were proven more flame resistant than neat UP. A study of a balanced combination of silica and ATH resulted in a fire self-extinguished in the UP composite (Halim et al., 2020). Further evaluation is the mechanical strength to find the optimum value of flame retardancy and mechanical strength.
3.4. Tensile and bending strength
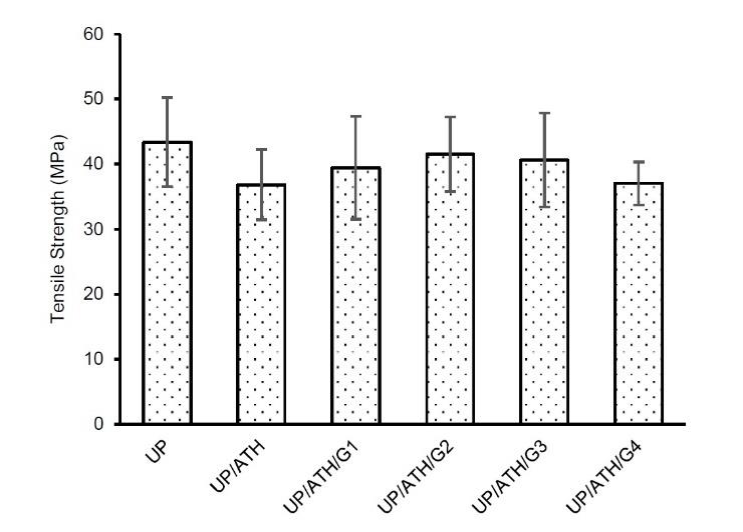
Figure 5 shows that neat UP produces the highest tensile strength of 43.4 MPa. The tensile strength of the samples with fillers reduces from 4.2% to 15%. The sample with G shows higher tensile strength than the sample with ATH only, which is the highest value generated by the sample UP/ATH/G2. The UP/ATH/G2 shows a composite with optimal composition than the other samples. The optimal composition is related to the porosity that influences the strength of the composites (Lanzl et al., 2020). Porosity causes the composite strength to increase and decrease again, with an optimal turning point composition of 50 vol%. Another study also shows the same result that more composition of G causes a decrease in the mechanical properties of a composite (Ku & Wong, 2012). Based on these results, a battery box can be made of UP composite with ATH and G, but attention to the decrease in tensile strength is still required.
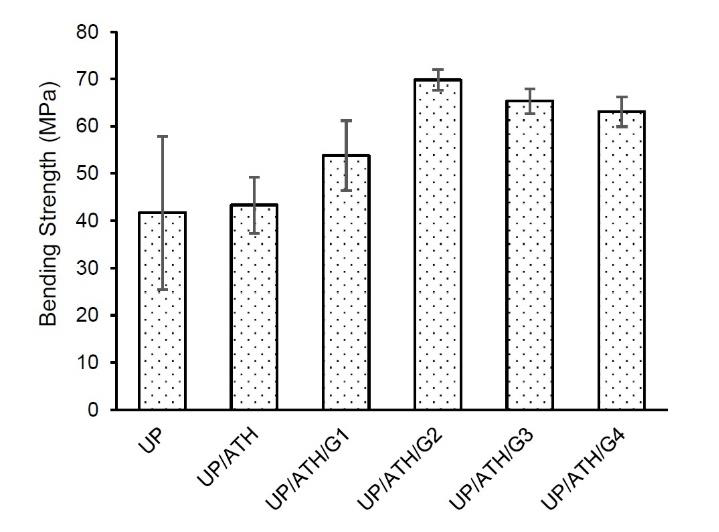
Figure 6 shows that the bending strength of samples with ATH and G is higher than that of neat UP. The addition of filler causes an increase in bending strength from 3.9% to 65.3%. The UP/ATH/G2 produces the highest bending strength of 68.9 MPa. The addition of a filler with a rigid character increases the bending strength of the sample. The addition of ATH to a composite did not have a significant impact on the stiffness of the material (Petersen et al., 2015). However, suitable compositions of G can increase the stiffness of the composite (Bhaskar et al., 2020; Ku & Wong, 2012). The short fiber shape of the G material can increase the bending strength of the composite (Nawafleh & Celik, 2020). The concentration and combination of fillers in UP cause an increase in composite stiffness, which is indicated by an increase in bending strength. This is in good agreement with the previous study (Misri et al., 2015). Based on these bending strength results, UP with ATH and G fillers is more appropriate to be applied to battery box components with a bending load direction, for example, the battery base.
3.5. Morphology of the samples fracture surface
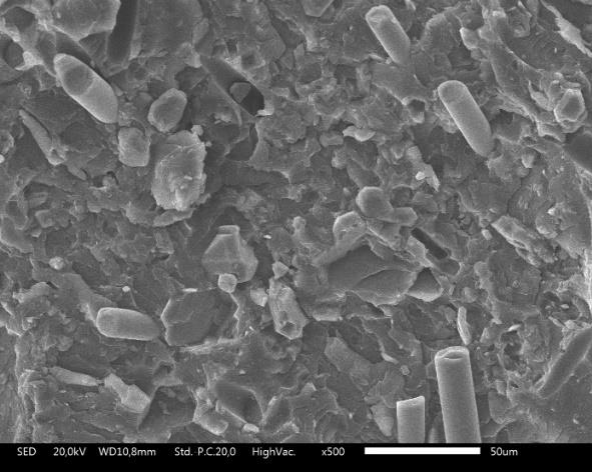
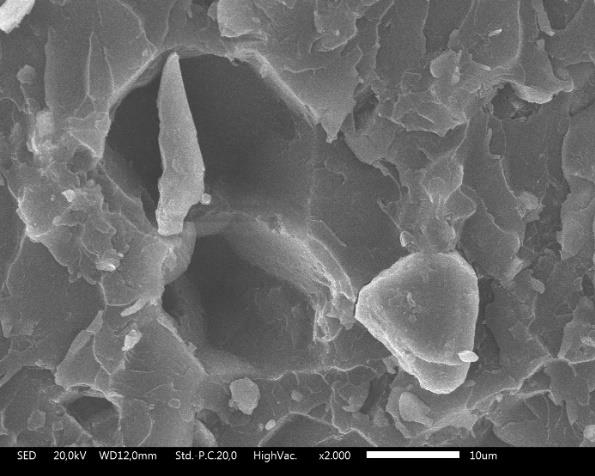
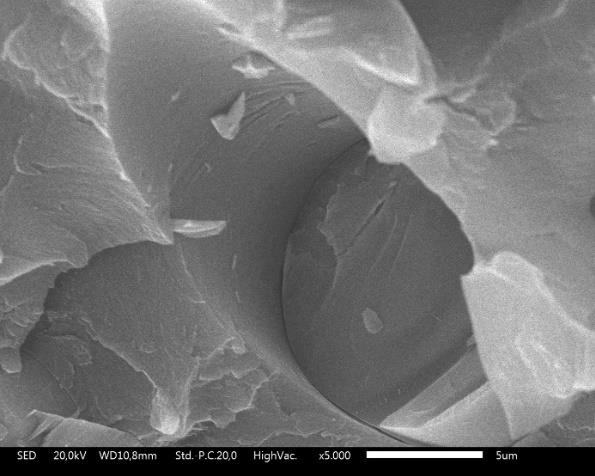
Observations on the morphology of the fracture surface of the mechanical test samples aim to determine the causes of the damage. Figure 7 is the fracture surface morphology of the UP/ATH/G2 sample. The observation result shows that the ATH and G particles were left behind and pulled out from the UP. The smooth cavity surface is evidence of weak interlock bonding between UP with ATH and UP with G. There is no visible structure observed between UP and fillers. The structure between UP and fillers can be made from a bonding agent which can react with the two composite components (Schuberth et al., 2016). ATH is a more rigid material than UP. The mechanical ability of a composite decreases in proportion to the addition of the ATH composition (Petersen et al., 2015). Figure 8 is a photograph of the ATH particles pulled out of the UP. The shape of the cavity follows the shape of the pulled-out ATH particles. The visible flakes are UP from a fractured sample. The G has a simpler shape than ATH, which is a cylindrical rod. Broken particles in Figure 9 prove good interlock bonding between UP and G. This filler increases the bending strength of the UP composite, although some G particles were detached from the UP (Sodeifian et al., 2019). The UP/ATH/G2 shows the highest bending strength. Overall, UP with ATH and G remain higher bending strength than samples without G or neat UP. This can occur because the filler G spreads by exfoliation in the UP, which can improve the mechanical ability of a composite (Han et al., 2008).
Conclusions
An experimental study was carried out to characterize several samples of UP, ATH, and G composites. Certain ATH and G compositions (21% and 4%, respectively) in the UP/ATH/G2 produce optimal combustion resistance and mechanical strength. The DSC results for thermal properties show that the maximum endothermic of all samples occurs at a temperature of around 70 °C. Thermal stability analysis through TGA proves that ATH and G can maintain the stability of UP so that they are degraded at higher temperatures by reducing the rate of weight degradation due to a temperature of around 0.1%/°C. The burning properties also show that samples with additional ATH and G fillers have a lower burning rate value than neat UP. A battery box can be developed from UP by adding ATH and G fillers with better resistance to temperature exposure. For mechanical characterization, the tensile strength of the samples added with ATH and G fillers was lower than the neat UP. However, UP/ATH/G2 showed an optimal composition compared to other filler compositions with a tensile strength of 41.5 MPa. This sample also produces an optimal bending strength of 68.9 MPa, even higher than the neat UP. These results were confirmed by SEM observations, in which the filler G was exfoliated in the UP. Composite failure due to broken G particles proves good interlock bonding between UP and G so this filler contributes to the increase of the UP composite mechanical strength. The study shows an outline of material development for battery boxes from UP with ATH and G fillers. The UP/ATH/G2 shows the best compromise between mechanical strength and flame retardancy.


 nueva página del texto (beta)


