


 nueva página del texto (beta)
 Inglés (pdf)
 Artículo en XML
 Referencias del artículo
 Enviar artículo por email
 Citado por SciELO
  Similares en
SciELO
Similares en
SciELO 
 Permalink
1. Introduction
The utilization of carbon as a material in significant applications is widely documented. Carbon is one of the most often used materials (Awan et al., 2017a; Awan et al., 2017b; Awan et al., 2019; Efiyanti et al., 2020; Sambudi et al., 2022; Nandiyanto et al., 2023; N’diaye, 2023). It is because of how well it works in the adsorption process (Anshar et al., 2016). Many techniques have been used to produce carbon for adsorbent, but the challenge in the utilization of carbon particles is to get an economical, sustainable, and environmentally friendly resource and adsorbent product. The most effective ones include converting biomass and agricultural waste (see Table 1) (Fiandini et al., 2020; Nandiyanto, Girsang, et al., 2020; Ragadhita et al., 2019; Nandiyanto, 2020; Nandiyanto, Arinalhaq et al., 2020; Nandiyanto et al., 2021; Nandiyanto, Maryanti et al., 2020).
Table 1 Recent studies on the utilization of agricultural waste-based adsorbents.
| Source of Agricultural Wastes | Adsorbent Type | Adsorbed Molecule Model | Results | Ref. |
|---|---|---|---|---|
| Pineapple peel | Carbon Microparticles | Curcumin Solution | The adsorption profile matches the Freundlich model which indicates that on the heterogeneous surface of the adsorbent, multilayer formation occurs. The interaction between the adsorbed molecules is of the type of physisorption (Van der Waals). The presence of multilayer formation is not accompanied by cooperative interactions between the adsorbed molecules because the adsorbent surface is porous. | (Nandiyanto, Girsang et al., 2020) |
| Rice Husk | Silica | Curcumin Solution | The adsorption equilibrium data matched the Freundlich model. Freundlich isotherm informs that the surface is heterogeneous and multilayer formation occurs. The surface of the adsorbent also contains mesoporous pores, so the adsorption rate is low. | (Ragadhita et al., 2019) |
| Rice Husk | Porous Activated Carbon | Curcumin Solution | The experimental results show that the adsorption process follows the Freundlich model which informs the formation of multilayers on a uniform surface. The use of porous structures in the adsorption process allows for greater adsorbate diffusion into the surface site and improved adsorption efficiency. | (Fiandini et al., 2020) |
| Pumpkin (Cucurbita maxima) Seeds | Carbon | Curcumin Solution | The models demonstrated that adsorbates interact with the carbon in multilayers via physical processes. The inorganic content of pumpkin seeds allows for the formation of carbon with porosities, resulting in more adsorption sites. Adsorbed molecules attract and bind to other free molecules. Adsorption occurs on energetically distinct sites in an endothermic process. | (Nandiyanto, 2020) |
| Soursop (AnnonaMuricata L.) Peel | Carbon Microparticle | Curcumin Solution | In the adsorption process the formation of a multilayer with adsorbate-adsorbate interaction is physical interaction (physisorption). Adsorption occurs energetically at various locations via endothermic processes. The calculated Gibbs free energy for all models is negative, indicating that the adsorption process occurs spontaneously. | (Nandiyanto, Arinalhaq et al., 2020) |
| Pumpkin (Cucurbita maxima) Seeds | Carbon Microparticle | Curcumin Solution | Adsorption with smaller particles has a direct impact on increasing adsorption capacity due to the presence of a larger surface area, a greater number of adsorption sites, and additional cooperative adsorption, i.e., adsorbate-adsorbate interaction. | (Nandiyanto et al., 2021) |
| Red Dragon Fruit (Hylocereus undatus) Peel | Carbon Microparticles | Curcumin Solution | The results of the analysis revealed that multilayer adsorption occurs for all sizes in the micrometer range and that the process involves physical interactions between adsorbate and adsorbent surfaces. The presence of multilayers is due to the possibility of porous structures in carbon microparticles. | (Nandiyanto, Maryanti, et al., 2020) |
This study demonstrated the production of carbon-based adsorbents from date palm seed waste. Although a variety of raw materials have been considered as prospective possibilities for carbon preparation, there has not yet been any research on date palm seeds as an effective low-cost carbon preparation. Date palm seed is one of the most common agricultural wastes with no commercial value. Date palm seeds are typically cultivated in the Middle East, and they are hardly found in Southeast Asia, such as Indonesia. However, since dates are employed in Muslim religious rites, particularly during the holy month of Ramadan, dates cannot be separated from Indonesian culture. Date seed waste is therefore prevalent in Indonesia during the holy month of Ramadan (date palm seeds make up roughly 11-18% of the weight of date fruit), although date seeds are still regarded as waste from the production of date-based goods). Large quantities of date palm seed thus accumulate as waste with no further use. Recognizing the process for reusing waste from date palm seed is important since it acts as a superior carbon source. Date palm seeds have high lignocellulosic content (Chang et al., 2020). Date seed contains 42% cellulose, 25% hemicellulose, and 11% lignin (Bouchelta et al., 2008). Although research on the utilization of date palms has been reported (Nabili et al., 2016; Nayl et al., 2017), analysis of the phenomena happening during the adsorption using carbon particles from date palms is typically nonexistent. This study used curcumin (as a model of dye) from aqueous solutions, which were done in the batch process under room temperature and pressure. To support the adsorption performance of date palm seeds, this study also investigated and evaluated the adsorption results by comparing them with current isotherm adsorption models. Although other research (as shown in Table 1) has established that carbon-based materials from agricultural waste sources have the best fit with the Freundlich adsorption isotherm model, this study evaluated and tested for 10 types of isotherm models (i.e., Langmuir, Freundlich, Temkin, Dubinin-Radushkevich, Fowler-Guggenheim, Hill-Deboer, Jovanovic, Harkin-Jura, Flory-Huggins, and Halsey) to make sure the phenomenon was occurring. To clarify the phenomena, we explored and assessed the suitability of adsorption isotherms with different sizes (i.e., 500, 250, and 100 μm).
2. Isotherm adsorption theory
Adsorption isotherm models such as Langmuir, Freundlich, Temkin, Dubinin-Radushkevich, Fowler-Guggenheim, Hill-Deboer, Jovanovic, Harkin-Jura, Flory-Huggins, and Halsey are used to evaluate the phenomenon during the adsorption process. When adsorption occurs in a monolayer, multilayer, or cooperative manner, this is a possible phenomenon of standard adsorption processes. Figure 1 depicts the phenomenon of the monolayer, multilayer, and cooperative adsorption processes. An explanation of the adsorption isotherm model is provided in detail below (Ragadhita & Nandiyanto, 2021).
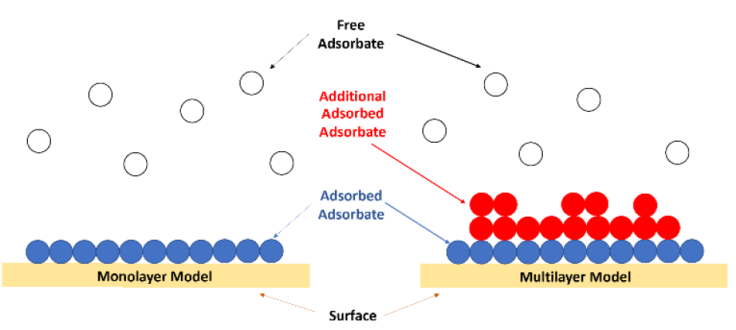
Figure 1 Illustration of the monolayer, multilayer, and cooperative adsorption process (Ragadhita & Nandiyanto, 2021).
2.1. Langmuir model
The Langmuir equation assumes that adsorption occurs on the specific surface of a homogeneous adsorbent. In addition, the Langmuir isotherm only forms a single layer when maximum adsorption, each atom is only adsorbed at the location on the adsorbent surface, and each part of the surface can only contain one molecule or atom. The Langmuir adsorption isotherm is written in Eq. (1) and (2).
Where K L is the Langmuir adsorption constant, Q max is the adsorption capacity of the monolayer (mg/g), and R L is the separation factor. Table 2 shows the meaning of the R L parameter.
Table 2 The meaning of the R L parameter.
| Condition | Explanation |
|---|---|
| R L > 1 | Unfavorable adsorption because desorption occurs |
| R L = 1 | Linear adsorption process that does not depend on the concentration |
| R L = 0 | Irreversible adsorption process because the adsorbate cannot diffuse (usually occurs in chemisorption) |
| 0 < R L < 1 | Favorable adsorption because no desorption occurs |
2.2. Freundlich model
Freundlich isotherm assumes that the adsorbent has a heterogeneous surface, and each molecule has a different adsorption potential. This equation is the most used. The Freundlich equation also shows the adsorption process, which is either reversible or irreversible, and still not forbidden to form an adsorption process that is a monolayer. The isotherm equation is expressed by Eq. (3).
Where k f is the Freundlich constant that estimates the adsorption capacity, C e is the adsorbate concentration at equilibrium (mg/L), n is the degree of linearity, and 1/n assumes the adsorption strength. n and 1/n parameters have the meaning as shown in Table 3.
Table 3 The meaning of the n and 1/n parameters.
| Condition | Explanation |
|---|---|
| n < 1 | Characteristic of the adsorption process with the chemisorption process |
| n = 1 | Characteristic of a linear adsorption process where there is a partition between two phases that is independent of concentration |
| n > 1 | Characteristic of the adsorption process with the physisorption process |
| 1/n < 1 | Characteristic of the normal adsorption process |
| 1/n > 1 | Characteristic of the cooperative adsorption process |
| 1 < 1/n < 0 | Characteristic of a favorable adsorption process because there is no desorption process |
| 0 < 1/n < 1 | Characteristic of the adsorption process that occurs on heterogeneous surfaces (a 1/n value close to 0 indicates that the adsorbent surface is increasingly heterogeneous). |
2.3. Temkin model
This type of isotherm contains an explicit factor related to the adsorbent-adsorbate interaction. By ignoring very low or high concentration values, this model assumes that the energy or heat of adsorption (a function of temperature) of all molecules in the layer will decrease linearly with increased coverage caused by adsorbent-adsorbate interaction, due to adsorbate-adsorbate repulsion and adsorbate adsorption uniformly distributed between layers. The Temkin isotherm equation is written in Eq. (4).
Where A T is the equilibrium constant of the Temkin isotherm model and βT is the Temkin isotherm. βT parameter is explained in Table 4.
2.4. Dubinin-Radushkevich model
The Dubinin-Radushkevich isotherm is generally applied to describe the adsorption mechanism with the distribution of Gaussian energy on a heterogeneous surface, The Dubinin-Radushkevich isotherm model predicts that the adsorption process follows a pore-filling mechanism. This model assumes that the adsorption has a multilayer character, involves van der Waals forces, and applies to the adsorption process physics. The Dubinin-Radushkevich isotherm equation is presented in Eq. (5).
Where q s is the theoretical saturation capacity (mg/g), is the Dubinin-Radushkevich isotherm constant which is correlated with the average free adsorption energy per mole of adsorbate, and ε is the Polanyi potential associated with equilibrium conditions. The Polanyi potential and the calculation of the adsorption energy are expressed by Eq. (6) and (7).
Where E is the adsorption energy which has the meanings shown in Table 5.
2.5. Fowler-Guggenheim model
The Fowler-Guggenheim isotherm explains how adsorbed molecules interact with one another. Eq. (8) expresses the Fowler-Guggenheim isotherm.
Where K FG is the Fowler-Guggenheim equilibrium constant (L/mg), and W is the interaction energy between the adsorbed molecules (kJ/mol). Table 6 summarizes the meaning of the W parameter.
Table 6 The meaning of the W parameter.
| Condition | Explanation |
|---|---|
| W > 0 kJ/mol | The attractive force between the adsorbed molecules and the process is exothermic |
| W < 0 kJ/mol | The repulsion between the adsorbed molecules and the process is endothermic |
| W = 0 kJ /mol | No interaction between the adsorbed molecules |
2.6. Hill-Deboer model
The Hill-Deboer isotherm model describes a situation in which there is both mobile adsorption and lateral interaction between adsorbed molecules (Rajabi et al., 2023; Jeyavishnu & Alagesan, 2020). The equation for the Hill-de Boer isotherm is expressed by Eq. (9).
Where K 1 is the Hill-de Boer constant (L/mg), and K 2 is the energetic constant of the adsorbed molecular interaction. Table 7 shows the meaning of the K 2 parameter.
Table 7 The meaning of the K 2 parameter.
| Condition | Explanation |
|---|---|
| K 2 > 0 kJ/mol | The attractive force between the adsorbed molecules and the process is exothermic |
| K 2 < 0 kJ/mol | The repulsion between the adsorbed molecules and the process is endothermic |
| K 2 = 0 kJ/mol | No interaction between the adsorbed molecules |
2.7. Jovanovic model
The Jovanovic model is based on the same assumptions in the Langmuir model, but it also considers the possibility of mechanical contact between the adsorbate and adsorbent. The linear equation of the Jovanovic isotherm is shown by Eq. (10).
Where Q e is the amount of adsorbate in the adsorbent at equilibrium (mg/g), Q max is the maximum adsorption of the adsorbate, and K J is the Jovanovic constant.
2.8. Harkin-Jura model
The Harkin-Jura isotherm model predicts multilayer adsorption on the surface of adsorbents with heterogeneous pore distribution. The equation of this model is expressed by Eq. (11).
where B HJ is related to the specific surface area of the adsorbent and A HJ is the Harkin-Jura isotherm constant.
2.9. Flory-Huggins model
The Flory-Huggins isotherm considers the surface coverage of the adsorbate on the adsorbent and assumes that the adsorption process occurs spontaneously. Eq. (12) represents the Flory-Huggins isotherm.
Where
Gibbs free energy (∆G°) of adsorption that occurs spontaneously, the value of ∆G° can be calculated from the equilibrium constant (K FH ) which is shown by Eq. (13).
The negative value of ∆G° indicates that the adsorption process is spontaneous and depends on temperature.
2.10. Halsey model
The Halsey isotherm evaluates adsorption with multilayer characteristics. The equation of the Halsey isotherm is shown by Eq. (14).
Furthermore, Eq. (15) is used to calculate the amount adsorbed by the unit mass of the adsorbent at equilibrium (Q e ).
where C o is the initial concentration (mg/L), C e is the equilibrium concentration (mg/L), m is the mass of the adsorbent (g), and V is the volume of the adsorbate solution (L).
2.11. Fitting data from models
Adsorption isotherms fitting data, calculation, and their parameters are summarized in Table 8.
Table 8 Adsorption isotherms fitting data, calculation, and their parameters.
| Isotherm Model | Linear Equation | Plotting | Parameters | |
|---|---|---|---|---|
| x-Axis | y-Axis | |||
| Langmuir |
|
|
|
|
| Freundlich |
|
lnC e | lnQ e |
|
| Temkin |
|
lnC e | Q e |
|
| Dubinin-Radushkevich |
|
ε2 | lnQ e |
|
| Flory Huggins |
|
|
log(1 - θ) |
|
| Fowler-Guggenheim |
|
θ |
|
|
| Hill-Deboer |
|
θ |
|
|
| Jovanovic | lnq e = lnq max - KjC e | C e | lnQ e |
|
| Harkin-Jura |
|
logC e |
|
|
| Halsey |
|
lnC e | lnQ e |
|
3. Materials and methods
3.1. Materials
The materials used in this study were date palm seed, ultrapure water, and curcumin (which were obtained by extracting turmeric from a local market in Bandung, Indonesia).
3.2. Carbon preparation
Date seeds are used to prepare carbon microparticles. Date seeds are washed to remove dirt first and dried. The dried date seeds were then carbonized using an oven at a temperature of 250°C for 3 hours to form carbon particles. After that, the carbon particles formed were ground to obtain fine particles and sieved to determine the specific particle size. The sieve-mesh used was equipped with pans with hole sizes of 500, 250, 100, 74, and 60 μm. For the understanding of the adsorption results, carbon microparticles with sizes of 500, 250, and 100 μm were tested.
3.3. Physicochemical characterization
A digital microscope was used to investigate the particle size and morphology of the raw material (calcium carbonate from chicken bone waste). Fourier transform infrared was used for chemical characterization to analyze elemental structure products (FTIR, FTIR-6600, Jasco Corp., Japan). Then, the analysis in the surface area and porous structure, nitrogen sorption measurement (Brunauer-Emmett-Teller (BET) Nova 4200e; Quantachrome Instruments Corp., US; operated at 77 K) was conducted.
3.4. Batch adsorption experiment
Carbon microparticles (0.05 g) with sizes of 500, 250, and 100 μm were added to the curcumin solution with various initial concentrations (100, 80, 60, 40, and 20 ppm) in a beaker with a capacity of 500 mL. Then, the mixture of the curcumin-carbon solution was shaken using a magnetic stirrer for 120 minutes at room temperature with constant pressure and pH (batch experiment). After the adsorption process was completed, the curcumin solution was filtered to separate the carbon particles using a nylon membrane syringe filter with a pore size of 0.22 μm.
Final concentrations were determined using a UV-VIS apparatus (Model 7205; JENWAY; Cole-Parner; US). The final concentration analysis was carried out by observing the maximum peak of the curve at a wavelength of 280-500 nm. The adsorption results were plotted and normalized. The maximum adsorption peak was calculated using Beer's Law to obtain the concentration of curcumin. The concentration data obtained were plotted and compared with standard adsorption isotherm models: Langmuir, Freundlich, Temkin, Dubinin-Radushkevich, Fowler-Guggenheim, Hill-Deboer, Jovanovic, Harkin-Jura, Flory-Huggins, and Halsey models.
4. Results and discussion
4.1. Physical properties of date palm seed
Figure 2 (a) shows digital microscope images, while Figure 2 (b) shows a Ferret analysis of carbon particles made from date palm seed. Figure 2 (a) demonstrates that the carbon particles are inhomogeneous in size, with a particle size range of 270 - 500 μm. Figure 2 (b) depicts the particle size distribution results, which show that most of the carbon particles have sizes ranging from 100 to 300 μm. To give you some perspective, the average particle size of carbon is 260 μm.

Figures 3 (a) and (b) were the adsorption/desorption curves to investigate the porosity and surface area of the particles with sizes of 500 and 100 μm, respectively. The characteristics of the adsorbent with a particle size of 500 μm followed Type III isotherm (Figure 3 (a)), indicating the existence of micropores. Adsorption does not take place with a single layer of molecules covering the substrate (forming a multilayer). Meanwhile, the adsorbent with a particle size of 100 μm had a BET adsorption type I (Figure 3 (b)), implying monolayer molecule adsorption on the substrate. The gaps between the atoms of the carbon microparticles are assumed to be nanometer-sized micropores capable of accepting and trapping molecules via Van der Waals interactions in this case.
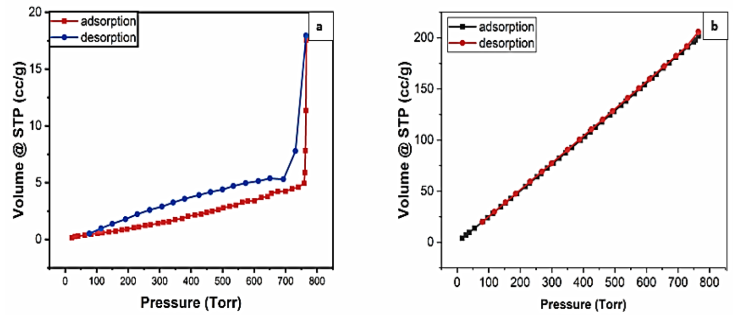
Figure 3 N2 adsorption-desorption isotherm of carbon microparticle having a size of 500 (a) and 100 (b) μm, respectively.
Table 9 summarizes the texture characteristics obtained based on the BET and BJH results for carbon microparticles with sizes of 500 and 100 μm. BJH analysis showed both particles had micropores (pore size of about 1.695). Based on Table 9, particle size has an impact on the surface area and pore volume of the adsorbent particles. The smaller size has an impact on the obtainment of a larger surface area and pore volume. For 250-μm carbon microparticles, BET analysis was not performed. However, the characteristics of the 250 μm carbon microparticles can be predicted to have performance between 100 and 500 μm.
Table 9 Surface characteristics of carbon microparticles adsorbents with sizes of 500 and 100 μm.
| Size of Carbon Microparticles Sample (μm) | BET Type Characteristics | BET Surface Area (m2/g) | Pore Volume (cm3/g) | Pore Size (nm) |
|---|---|---|---|---|
| 500 | Type-III | 5.548 | 0.026 | 1.695 |
| 100 | Type-I | 178.604 | 0.288 | 1.695 |
In addition, since the pores are in the range of micropore size range (about 1.6 nm; see Table 9), we can conclude that all adsorptions will be done on the outer surface. Molecules must be less than 1 nm to get the deepest pore position.
Figure 4 reveals information about the functional groups present in the date palm seed-based carbon and date palm seed. Based on FTIR data, functional groups shift to different frequencies or, in some cases, disappear and appear when date seeds are treated with carbonization. There were broad peaks in the ~3400 - 3100 cm-1 region for the date palm seed-based carbon and date palm seed samples which were associated with the O-H stretching vibration of the hydroxyl functional groups. However, in the date seed-based carbon sample, the absorption of functional groups in that area decreased in intensity, indicating the loss of some moisture due to the carbonization process. The peak around 2926.11 - 2856.67 cm-1 in both samples indicates the presence of methyl and methylene functional groups associated with asymmetric C-H bands. These absorption bands show contributions from cellulose, hemicellulose, and lignin. The peak in the adsorption area ~1745.65 cm-1 in both samples indicated the presence of a carbonyl (C=O) associated with an ester group on the hemicellulose bond or an ester of the ferulic carboxylic group and p-coumaric acid lignin and/or hemicellulose. Vibrations that show aromatic groups such as C=C and C=N are shown in the adsorption around 1627.97 - 1616.40 cm-1 in both samples. The aromatic skeleton mode indicated by stretching C=C was indicated by the presence of adsorption around 1446.66 - 1437.02 cm-1 in both samples. The peak at 1375.29 cm-1 in both samples is caused by cellulose C-H stretching. The adsorption band at ~1242.20 cm-1 in both samples is the C-O-H deformation and C-O stretching of the phenolic group. The C-O stretching vibration of cellulose and hemicellulose in both samples is described by the band at 1089.82 - 1057.03 cm-1. The adsorption at 871.85 cm-1 in both samples is related to cellulose's C-H rocking vibrations (Nabili et al., 2016). The peaks from the results of the FTIR analysis in detail are also summarized in Table 10.

Table 10 Summarized of FTIR results of date palm seed.
| Wavenumber (cm-1) | Band Origin |
|---|---|
| 3373.61 | O-H stretching in hidroxyl functional group |
| 2926.11 | Asymetric C-H in metil and methylene functional group |
| 2854.74 | Simetric C-H in metil and methylene functional group |
| 1745.64 | C=O in ester groups in hemicellulose and lignin |
| 1627.97 | C=C or C=N from the aromatic region |
| 1437.02 | C=C stretching from aromatic region |
| 1375.29 | C-H stretching of cellulose |
| 1242.20 | C-O-H deformation and C-O stretching in phenolic functional group |
| 1155.40 | C-O-C in cellulose dan hemicellulose |
| 1089.82 | C-O stretching in cellulose dan hemicellulose |
| 871.85 | C-H rocking in cellulose |
4.2. Adsorption characteristics of carbon microparticles based on isotherm models
Figure 5 shows the percent adsorption efficiency of carbon microparticles against time. Based on Figure 5, the adsorption efficiency of the carbon microparticle adsorbents having sizes 500, 250, and 100 μm were 34.10, 49.70, and 53.44%, respectively. The adsorption results show that the ability of the adsorbent to absorb adsorbate molecules depends on the particle size. Adsorbents with small particle sizes have the best adsorption efficiency than larger adsorbent particle sizes due to small particles having a high surface area. This is also reinforced by the results of the BET analysis that shows that the small particle size has an impact on the high surface area (see Table 9). In adsorption, smaller particles have a higher specific surface area and more adsorption sites, which may explain why carbon microparticles with an outer diameter of 100 μm have a higher adsorption efficiency to adsorb dye waste compared to sizes 500 and 250 μm. This is consistent with previous findings that adsorbents with small particle sizes have a larger surface area and thus a higher absorption rate (Nandiyanto, Ragadhita & Istadi, 2020).

To investigate the adsorption model, experimental data were subjected to get regression analysis to fit the linearized expression of mathematical models. The experimental values are reconstituted based on the plotting of some parameters (using plot equations in Table 11). Figures 6 (a-j) plot analysis results of ten model isotherm adsorptions. The following sections provide detailed explanations for each model.
Table 11 Detailed data of adsorption isotherm parameters.
| Model | Parameters | Particle Size (μm) | Notes | ||
|---|---|---|---|---|---|
| 100 | 250 | 500 | |||
| Langmuir | R2 | 0.9243 | 0.9503 | 0.9876 | Monolayer existence on the surface of the adsorbent (R2 > 0.80) |
| Q max (mg/g) | 38.759 | 20.45 | 13.14 | Maximum capacity adsorption | |
| K L (L/mg) | 0.006 | 0.008 | 0.009 | The small value Langmuir constant indicates weak interaction between adsorbate and adsorbent | |
| R L | 0.675-0.892 | 0.900-0.990 | 0.894-0.990 | Favorable adsorption (0 < R L <1) | |
| Freundlich | R2 | 0.8189 | 0.8492 | 0.9846 | Multilayer existence on the heterogeneous surface of adsorbent (R2 > 0.80) |
| N | 0.743 | 0.7675 | 0.7055 | Chemisorption (n < 1) | |
| 1/n | 1.346 | 1.3028 | 1.4173 | Cooperative adsorption with favorable characteristics (1/n > 1) | |
| K f (mg/g) | 0.049 | 0.100 | 3.842 | The adsorption capacity of the adsorbent | |
| Temkin | R2 | 0.5718 | 0.6407 | 0.8929 | Homogenous distribution adsorbate in the adsorbent surface (R2 < 0.80) |
| A T (L/g) | 2.423 | 0.070 | 0.071 | Temkin equilibrium binding constant | |
| β T (J/mol) | 86.872 | 161.731 | 205.860 | Physisorption (β T < 8 kJ/mol) | |
| Dubinin-Radushkevich | R2 | 0.9003 | 0.8023 | 0.9681 | The adsorbent surface contains micropores (R2 > 0.80) |
| β T (mol2/kJ2) | 4.7507 | 5.0048 | 5.8589 | Dubinin-Radushkevich isotherm constant | |
| E (kJ/mol) | 0.324 | 0.316 | 0.292 | Physisorption (E < 8 kJ/mol) | |
| Fowler-Guggenheim | R2 | 0.0503 | 0.0515 | 0.6442 | Monolayer existence on the surface of the adsorbent (R2 < 0.80) |
| W (kJ/mol) | -23.795 | -27.253 | -29.002 | Repulsive interaction between an adsorbed molecule (W < 0 kJ/mol) | |
| K FG (L/mg) | 0.002 | 0.002 | 0.001 | Fowler-Guggenheim isotherm constant | |
| Hill-Deboer | R2 | 0.1078 | 0.0913 | 0.5964 | Monolayer existence on the surface of the adsorbent (R2 < 0.80) |
| K 1 (L/mg) | 0.002 | 0.001 | 0.010 | Hill-Deboer isotherm constant | |
| K 2 (kJ/mol) | -35.904 | -37.056 | -39.876 | Repulsive interaction between adsorbed molecule (K 2 < 0 kJ/mol) | |
| Jovanovic | R2 | 0.8545 | 0.8725 | 0.856 | Monolayer existence on the surface of the adsorbent (R2 > 0.80) |
| K J (L/mg) | 0.1194 | 0.2092 | 0.205 | Jovanovic isotherm constant | |
| Q max (mg/g) | 2.522 | 3.896 | 6.935 | Maximum uptake of adsorbate | |
| Harkin-Jura | R2 | 0.3016 | 0.2882 | 0.2605 | Monolayer existence on the surface of the adsorbent (R2 < 0.80) |
| A HJ | 0.017 | 0.048 | 0.051 | Harkin-Jura isotherm constant | |
| Β HJ | 1.392 | 1.408 | 1.349 | Related to the surface area of the adsorbent | |
| Flory-Huggins | R2 | 0.0004 | 0.0079 | 0.713 | Monolayer existence on the surface of the adsorbent (R2 < 0.80) |
| n FH | 0.0021 | 0.0066 | 0.0648 | The adsorbate occupies more than one active adsorbent zone (n FH < 1) | |
| K FH (L/mg) | 0.870 | 0.861 | 1.230 | Flory-Huggins isotherm constant | |
| ΔG° (kJ/mol) | -0.316 | -0.370 | -0.512 | Spontaneous adsorption (ΔG°< 0) | |
| Halsey | R2 | 0.8189 | 0.8492 | 0.9874 | No monolayer existence on the surface of the adsorbent (R2 > 0.80) |
| N | 0.742 | 0.767 | 0.705 | Halsey isotherm constant | |
| K H | 0.181 | 0.050 | 0.014 | Halsey isotherm constant | |
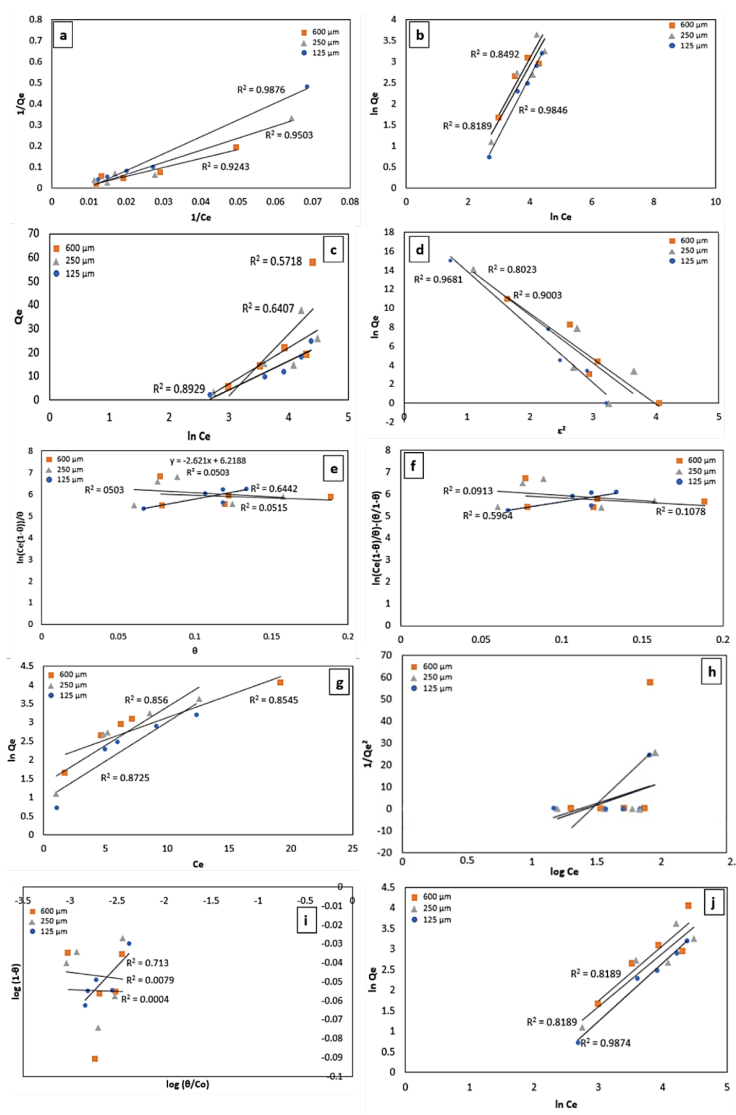
Figure 6 Data fitting with isotherm models Langmuir (a), Freundlich (b), Temkin (c), Dubinin-Radushkevich (d), Fowler-Guggenheim (e), Hill-Deboer (f), Jovanovic (g), Harkin -Jura (h), Flory-Huggins (i), and Halsey (j)
Figure 6 (a) shows the plotting curve of the Langmuir model based on Equations 1 and 2. The R 2 value of this model is highest compared to the other model, informing that the adsorption process follows this model. Langmuir's model assumes that the adsorption process is forming a monolayer on a homogeneous adsorbent surface. Based on the Langmuir model, the maximum adsorption capacity (Q max ) of carbon par-particles as an adsorbent for sizes 500, 250, and 100 mm is 13.14, 20.45, and 38.76 mg/g, respectively (see Table 11). The separator factor value revealed values ranging from 0 to 1 (see Table 11), indicating that the adsorption process is favorable. The Langmuir adsorption constant (K L ) indicates the degree of adsorbate-adsorbent interaction. A higher K L value indicates a strong adsorbate-adsorbent interaction, whereas a lower K L value indicates a weak interaction between the adsorbate molecule and the adsorbent surface. The K L value for all adsorption systems is relatively small, indicating a weak interaction between the adsorbent and adsorbate molecules due to the active site only adsorbing one molecule.
Figure 6 (b) shows the plotting curve of the Freundlich model based on Equation 3. The R2 in the Freundlich model is greater than 0.80, thus the adsorption process fits with the Freundlich model. Freundlich's model assumes that there is multilayer formation in the adsorbent surface. Analysis of the n and 1/n values show that n < 1 and 1/n > 1 informing adsorption profile has chemisorption characteristics with cooperative interaction between adsorbed molecules (see Table 11).
Figure 6 (c) is the plotting data based on Temkin isotherm using Equation 5. The adsorption process does not follow the Temkin model due to R2 being less than 0.80 except adsorption system using small particle size due to R2 > 0.80. Based on the Temkin model, the adsorption process has a physisorption character due to β T < 8 kJ/mol (see Table 11). Therefore, based on the Temkin model, the adsorption system using small particle adsorbent shows physisorption characteristics. However, The Temkin equilibrium constant corresponds to the maximum binding energy, and a high A T indicates an attractive interaction between the adsorbate-adsorbent system. Here, the A T value for all adsorption systems is relatively small, indicating that there is less affinity between the adsorbent and adsorbate molecules due to physical interactions, as confirmed by the β T parameter.
Figure 6 (d) shows the Dubinin-Radushkevich isotherm plotting based on Equations 6 and 7. The R2 is relatively high (R2 > 0.80), thus adsorption process follows micropore filling. Parameter E (see Table 11) in this isotherm describes the interactions between adsorbed molecules with physisorption characteristics. In Table 11, the β parameter is the Dubinin-Radushkevich isotherm constant-related saturation capacity. A high value of the β parameter indicates a high adsorption capacity. Pore volume affects the β value. The greater the pore volume impact the greater the maximum binding energy value.
Figure 6 (e) shows Fowler-Guggenheim isotherm plotting based on Equation 8. Based on the analysis, Fowler-Guggenheim has R2 = 0.0503 which explains the adsorption process does not follow this model. Interaction between adsorbent and adsorbate showed by the K FG value. A higher K FG value indicates a good adsorbent-adsorbate interaction. Because there are surface-active sites that are less efficient in adsorbing the adsorbate molecules due to physical interaction dominance, adsorbent systems show identically small K FG values, indicating weak interaction adsorbent-adsorbate. The interaction energy between the adsorbed molecules (W) confirmed repulsive interaction between an adsorbed molecule (W < 0 kJ/mol) (see Table 11).
The adsorption analysis revealed that the Langmuir isotherm model is the best based on the R 2 value (closer to 1) from linear fitting analysis (see Table 11). According to the data in Table 1, the five best-fit isotherm models are Langmuir > Dubinin-Radushkevich > Jovanovic > Freundlich > Halsey. The five best models are taken because they have an R2 > 0.80.
Based on the results of the adsorption isotherm analysis, the adsorption system with carbon particle adsorbent from date palm seeds showed adsorption with the formation of monolayer and multilayer. The formation of the monolayer was confirmed by the Langmuir and Jovanovic isotherms. The formation of this monolayer occurs because there are several sites on the adsorbent whose surface is homogeneous. Based on the Langmuir isotherm, adsorption was normal and favorable which was confirmed by the value of the R L parameter which was between 0 and 1. Meanwhile, Freundlich and Halsey's isotherm model confirmed the existence of multilayer formation on heterogeneous adsorbent surfaces. The values of n <1 and 1/n > 1 in the Freundlich model indicate the degree of linearization between adsorbate and adsorbent; the values show that adsorption follows cooperative adsorption with chemical interactions (Ragadhita & Nandiyanto, 2021). Cooperative adsorption provides information about the occurrence of chemical and physical interactions at the same time (Liu, 2015). The chemical interaction in the adsorption system is consistent with the Temkin model parameter value β T > 8 J/mol. The presence of a heterogeneous structure in the adsorbent is also assumed by the Dubinin-Radushkevich isotherm which also contributes to the multilayer adsorption process (Dada et al., 2012). Furthermore, because the parameter value E < 8 kJ/mol in the Dubinin-Radushkevich isotherm, the Dubinin-Radushkevich model confirmed the physical interaction. The prediction model for carbon-based adsorbent from date palm seed is illustrated in Figure 7. In addition, since the pores are in the range of micropore size range (about 1.6 nm; see Table 9), we can conclude that all adsorption will be done on the outer surface. Molecules must be less than 1 nm to get the deepest pore position.
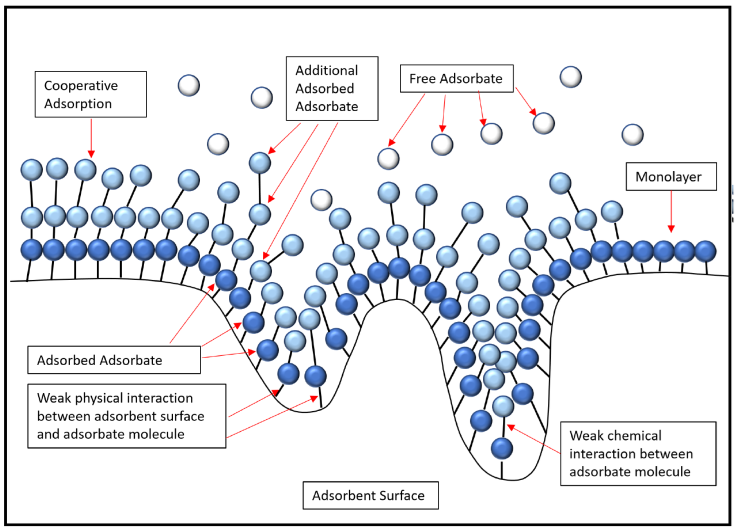
Figure 7 Prediction model for carbon-based adsorbent from date palm seed (adopted from Ragadhita & Nandiyanto, 2021).
5. Conclusion
Isotherm adsorption of carbon particles from date palm seed in an aqueous solution has been successfully investigated. The adsorption process followed suitability with five isotherms, namely Langmuir > Dubinin-Radushkevich > Jovanovic > Freundlich > Halsey. Overall, the adsorption process revealed the formation of monolayers and multilayers on a homogeneous (uniform) surface. The adsorption proceeds normal, spontaneous, and favorable process, with physical and chemical interactions between adsorbate molecules at one time (cooperative adsorption). Adsorption with physisorption interaction has been done for attracting adsorbate molecules to the adsorption site via the Van der Waals force. Meanwhile, there are also molecular interactions where the molecules are attached to the surface through the formation of chemical bonds.

