


 nueva página del texto (beta)
 Inglés (pdf)
 Artículo en XML
 Referencias del artículo
 Enviar artículo por email
 Citado por SciELO
  Similares en
SciELO
Similares en
SciELO 
 Permalink
Introduction
ACE is a protein of the peptidases chloride-dependent family which makes the catalysis of dipeptides liberation from the C-terminal extreme of its substrate, the angiotensin I [1]. The ACE’s role is to carry out the regulation of blood pressure and it is involved in the conversion of decapeptide, Angiotensin I, into octapeptide Angiotensin II, this last compound possesses the maximum vasopressor capacity. Also, ACE makes the inactivation of Bradykinin vasodilator [2] both processes provoke as a consequence the increase of the blood pressure.
It has been reported that the increase of activity of the ACE at a serum level can produce different pathologies as sarcoidosis [3], in which the levels of the enzyme in blood serum are a very stable indicator for the diagnosis of the sarcoidosis disease [2]. Currently, there are different drugs for hypertension and congestive heart failure treatment [4, 5].
It is evident that is necessary to search for an accurate inhibitor due to the clinical relevance of the ACE activity. Different techniques have been applied, to reach that objective, such as spectrophotometry[6, 7], fluorometry[8] or radioisotopic[9, 10] methods, besides some theoretical studies have been carried out to predict the possible interaction of new compounds and compare them with the ones already available in the market [11]. The methods of separation and quantification through HPLC started to be developed because of the complicated separation of hippuric acid through the extraction with dissolvent; added to this the separation could not be performed completely [12-14]. Nowadays, different methods have been applied using Capillary Electrophoresis (CE) to separate the HA from the enzymatic reaction between hippuryl histidyl leucine (HHA) and ACE; and to quantify the obtained products with more accuracy. [15-17].
The quantification of ACE activity by capillary zone electrophoresis has been reported [3], and the in-line reaction conditions are well established, where ACE activity is quantified using HHL as tripeptide substrate [2]. In this reaction, the ACE releases Histidyl-Leucine (HL) and Hippuric Acid (HA); this last compound is easily detected with a UV detector at 254 nm.
The CE is a very powerful analytical tool that is able to do separations with an adequate resolution short analysis time and using small sample volumes (usually µL).
The systems of CE have been applied in a very successful way for in-line enzymatic reactions through a methodology known as electrophoretically mediated microanalysis, also known as EMMA [18]. EMMA takes advantage of all the different electrophoretic mobilities of a protein, the substrate and the product for quantification using an in-line reaction. This technology has been used in different biochemical systems [19-27].
To perform the methodology described by S. Van Dyck, the enzymatic reactions were carried out in-line. A stand by time of interaction was necessary in order to perform the reaction and subsequently, voltage was applied to separate and quantify the products of the reaction. The variable in respect to an EMMA analysis is that the enzyme and the substrate are not mixed before the injection to the separation system. The in-line technique described by Taga et al. [28], who made the CE with a derivatization of the reactions inside the capillary using amino acids as model compounds.
On the other hand, in 1985 Stout and his collaborators conducted studies of a natural product known as changroline [29], a substance that showed to have an antiarrhythmic and hypotension effect. In order to determinate which region of the molecule is the responsible for the biological effect, they divided the molecule into three zones, concluding that region 2 is the one responsible of the pursued biological activity (Fig. 1) [30-31].

Considering Stout’s work, our group purposed to change the pyrrolidine ring and used the morpholine and thiomorpholine systems instead. In 2007 we synthetized and characterized a group of compounds derived from phenol, named LQM300 [32].
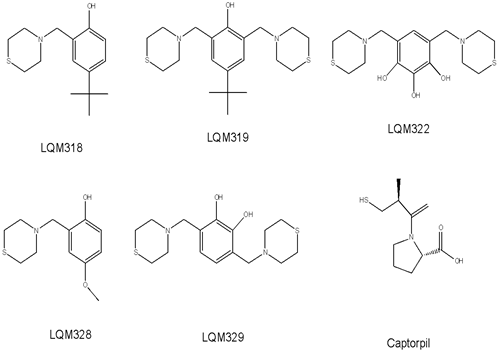
These new compounds were tested in rat model [33], from which the compounds(4-tert-butyl-2-(thiomorpholin-4-ylmethyl)phenol (LQM318) 4-tert-butyl-2,6-bis(thiomorpholin-4-ylmethyl)phenol (LQM319), 3,5-bis(thiomorpholin-4-ylmethyl) pyrogallol (LQM322), 4-methoxy-2-thiomorpholin-4-ylmethyl-1-phenol (LQM328),3,6-bis(thiomorpholin-4-ylmethyl)benzene-1,2-diol (LQM329) (Fig. 2), were the best candidates from a series of 25 tested molecules. The computational studies previously described [11] indicated a similarity of its biological activity with Captopril and its inhibition is known to act at the level of the ACE, this group of compounds were protected through a patent [33].
A way to determine the level of inhibition is to use the methodology described by S. Van Dyck, et al. [24] where the initial conditions for the analysis were stablished. Also using the computational studies reported results we made the comparative study with the ACE activity using the HHL substrate through the Capillary Zone Electrophoresis (CZE), using Captopril as a positive blank.
Experimental
Chemistry
The LQM300 compounds were obtained and characterized as it is mentioned at reference [32].
Instrumentation of CE
All the experiments were made in a CE equipment (Beckman Coulter, ProteomeLab PA 800, Fullerton, CA, USA). The detection was made in line with 254 nm with a diodes arrangement detection system. The migration time and the area under the curve (AUC) were collected and analyzed through the P/A800 MDQ software (version 1.5). The capillary used was made of fused silica (Polymicro Technologies, Phoenix AZ, USA) of 30 cm long (20 cm from the injection place to the detector) and an internal diameter of 75 μm.
CE Conditions and solutions
The reagents such as HHL, HA, ACE, Captropril, NaCl and HEPES buffer, which were used during the experimentation, were obtained through Sigma-Aldrich. The capillary temperature was regulated at 37 °C with a cooling liquid during all the experiments.
Type 1 water was used for the preparation of all the solutions and the washing procedure of capillary. Before the solutions were loaded in the CE equipment, they were passed through a 0.45 μm nylon filter (Alltech, Lokeren, Belgium) except the ACE solution. A new capillary was used and treated previously with NaOH 0.1M, type 1 water and running buffer, each treatment lasted 20 minutes.
The running buffer consists of a 150 mM HEPES (4-(2-hydroxyethyl)-piperazine-1-ethanesulfonic acid) solution, (Sigma-Aldrich, USA) adjusted to pH 8.0 with 0.1 M NaOH (BDH, Poole, UK). At the beginning of each day the capillary was conditioned through a washing cycle at 20 psi, starting with 0.1 M NaOH for 15 minutes, then 15 minutes with water and 20 minutes with the running buffer.
Previous to each reaction mixture analysis, the capillary was washed with 0.1 M NaOH and with water for 2 minutes each one besides using a washing procedure of 3 minutes with the running buffer.
During each step of the injection of substrate or the enzyme, the final part of the capillary (and the electrode) were immersed into the buffer with the objective to prevent the system from returning because of the syphon effect.
The HHL, HA and ACE of rabbit lung with 0.1 U of activity were obtained from Sigma-Aldrich (USA). The HHL and ACE were dissolved and prepared with 10 mM (pH 8.0) HEPES buffer and 150 mM of NaCl. The HA for the calibration curve was dissolved in water type 1. The compounds and the solutions of ACE and the HHL were kept at 4 °C and before using them, they were set rest so that they reached room temperature.
Calibration curve of HA at different concentrations
The stock solution of the HA at 6.25 mM was prepared dissolving the HA in a H2O/DMSO (Dimethyl sulfoxide from Sigma Aldrich USA) 50:50. This mixture was used due to the low solubility of the LQM compounds. However, this solution has to be used during the calibration procedure in order to have the same matrix for every system. There were five systems, series of HA solutions into different concentrations, were prepared from the same stock solution in the 10 mM (pH=8.0), HEPES buffer, containing 150 mM NaCl, The curve goes through a concentration range of 0.1 to 0.55 mM, where the system 1 was the most diluted system and system 5 was the most concentrated HA solution. Each system was analyzed three times at 254 nm. Each HA migration time was used to evaluate the precision of the method and the AUC was also analyzed in order to obtain an equation to compute the HA concentration.
In-line Reaction
Sandwich injections were carried out for the enzyme-substrate reaction. Before and after the sandwich injections cycle, water was injected (0.3 psi, 3s), enzyme (3 psi, 5 seconds each) and substrate (3 psi, 5 seconds). A period of waiting time for 10 minutes was set to perform the reaction inside the capillary and later a separation voltage of 6 kV was applied. The steps of the method applied for the procedure of washing, injection and reaction conditions are showed in Table 1.
Table 1 The procedure of the in-line reaction and capillary conditions. The temperature of the capillary was regulated at 37 °C with antifreeze liquid during the entirety of the analysis. Each analysis was carried out three times.
| Action | Solution | Presure (psi) | Voltage (kV) | Time |
|---|---|---|---|---|
| Washing | NaOH | 20 | - | 2 min |
| Water | 20 | - | 2 min | |
| Buffer | 20 | - | 2 min | |
| Injections | Water | 0.3 | - | 3 s |
| Enzyme | 0.3 | - | 5 s | |
| Substrate-inhibitor | 0.3 | - | 5 s | |
| Enzyme | 0.3 | - | 5 s | |
| Water | 0.3 | - | 3 s | |
| Waiting time | - | - | - | 10 min |
| Separation and quantification | - | - | 6 | 15 min |
HHL was used as a substrate with a concentration of 1 mM each mixed with 39.5 mM of inhibitors. A stock solution was prepared, dissolving HHL with 10 mM, pH 8.0 of HEPES buffer and 150 mM NaCl. Captopril and the LQM300’s compounds were used as inhibitors, which were dissolved in a H2O/DMSO (50:50) mixture. Each substrate/inhibitor solution was diluted with 10 mM, pH 8.0 of HEPES buffer and was analyzed three times.
Results and discussion
In-line reaction through capillary electrophoresis.
Five LQM compounds were selected (Fig. 2) to determine the inhibitor effect upon the ACE with respect to the HHL with the procedure reported previously [3]. To improve the detection of the HA a 10 min waiting time was applied. This will lead to a higher concentration of HA.
The injection order and conditions are shown in Table 1. The substrate plug can either contain or not contain the inhibitor compound in order to observe its effect. This has the advantage that by adding the compound to that plug, it will not cause an inhibition until the mixture is completed. On the other hand the order of the injection of each component in the capillary is aimed to guaranty that the evaluated compounds react as a whole at the same time.
Calibration Curve of HA
In order to determine the ACE inhibition, the HA must be quantified. The calibration curve was measured as described in the experimental section 2.4. However, for the statistical part for the calibration curve the corrected migration time was not used.
Due to the low solubility of the inhibitors in water, they were dissolved in a 50:50 water / DMSO mixture. It should be mentioned that under these conditions the mixture is stable only on the same day so it must be prepared fresh.
The statistical analysis was made based on the migration time of HA and the AUC for each one of the measurements (Table 2), proving that the results are statistically precise for the migration time measurement (V.C.= 2.8 %) and for the AUC with a coefficient percentage of a maximum variation of 6.5 % (Fig. 3 and Fig. 4). The parameter measured was the migration time, this was in order to identify the HA and to verify that the method is reproducible.
Table 2 Statistical analysis from the migration time and the AUC for each system. SD stands for standard deviation, CV stands for coefficient of variance; both of them are for AUC and for HA migration time measurements.
| System 5 | System 4 | System 3 | System 2 | System 1 | |
|---|---|---|---|---|---|
| AUC | 5802 | 5076 | 3856 | 2980 | 2140 |
| SD | 321 | 47 | 150 | 195 | 72 |
| CV | 0.055 | 0.009 | 0.039 | 0.065 | 0.034 |
| Average HA migration time | 7.95 | 7.8 | 7.84 | 7.99 | 7.79 |
| SD for HA migration time | 0.32 | 0.14 | 0.18 | 0.33 | 0.15 |
| CV for HA migration time | 0.040 | 0.018 | 0.023 | 0.041 | 0.019 |

Fig 3 Data dispersion from the calibration curve (concentration mM vs AUC). The plot shows the measurements and the average of the AUC (yellow dots). Also the equation is showed and the final correlation coefficient of this process was: r2 = 0.994.

Fig 4 Typical electropherogram obtained after on-line reaction at the capillary inlet, without any inhibitor added to the substrate plug. The concentration of ACE: 0.1 U/ml, HHL: 1 mM, HA: 0.78 mM. Waiting period of 10 min. CE conditions: run buffer: 150 mM HEPES (pH 8.0); applied voltage: 6 kV; detection at 254 nm, capillary cartridge temperature: 37 ºC.
Comparison of different inhibitors
To determine the inhibition of the ACE with the different LQM compounds the procedure described in section 2.4 was performed three times for each one of the compounds, including Captopril and using the reaction without inhibitor as a reference, for 100 % of the reaction product. In order to compute the HA concentration, the equation from the calibration curve was used. Making the interpolation with the mentioned equation, we can get the HA concentration directly from the AUC readings, and applied to the inhibition percentage equation.
The inhibition percentage of each compound was calculated through the expression:
The blank refers to the HA concentration in the reaction with no inhibitor, in our case was 0.78 mM and the analysis of results is shown in Table 3. Where the total inhibition stands for each compound level of inhibition compared to the solution without any inhibitor. And the relative inhibition is measured compared with the Captopril level of inhibition, which for this study was taken as the 100 %. The LQM322 compound has the second higher inhibition activity (Fig. 5), with almost 80% of inhibition, although this compound is the best of the new proposed compounds, it is still under the inhibition percentage of Captopril (Fig. 6).
Table 3 Total inhibition percentage (average) of ACE and relative inhibition regarding Captopril. The migration time presented in this table is the corrected migration time.
| Inhibitor | tm HA/H2O (min) | % Total Inhibition | % Relative Inhibition |
|---|---|---|---|
| 318 | 2.3 | 26.5 | 28.9 |
| 319 | 2.3 | 29.3 | 31.8 |
| 322 | 2.5 | 80 | 86.8 |
| 328 | 2.5 | 34 | 36.6 |
| 329 | 2.4 | 4.7 | 5.1 |
| Captopril | 2.8 | 92.1 | 100 |
| Without inhibitor | 2.6 | Not detected | Not detected |

Fig 5 Electropherogram obtained after on-line reaction at the capillary inlet, with LQM322 compound added to the substrate plug. The concentration of ACE: 0.1 U/ml, initial HHL: 1 mM concentration. HA: 0.23 mM. Waiting period of 10 min. CE conditions: run buffer: 150 mM HEPES (pH 8.0); applied voltage: 6 kV; detection at 254 nm, capillary cartridge temperature: 37 ºC.

Fig 6 Electropherogram obtained after on-line reaction at the capillary inlet, with Captopril compound added to the substrate plug. The concentration of ACE: 0.1 U/ml, initial HHL: 1 mM concentration. HA: 0.058 mM. Waiting period of 10 min. CE conditions: run buffer: 150 mM HEPES (pH 8.0); applied voltage: 6 kV; detection at 254 nm, capillary cartridge temperature: 37 ºC.
Electrophoretic Mobility
Electro-osmosis, as well as electro migration, is an electro-kinetic phenomenon that happens when an potential difference is applied to a fluid system in direct contact with a charged surface, like in the CE, and this is called electroosmotic flow (EOF).
This expression is used to correct migration apparent time:
where, ti: effective or real migration time of compound i (s); LT: total length of the capillary separation (cm); μe: compound i mobility only for electro migration (v/E=cm2/V*s); μeo: electroosmotic mobility and V: applied voltage.
As observed in Equation 2, effective migration time depends on the mobility of the solute and the EOF. To identify EOF in an electropherogram, it is necessary to add a marker, a neutral substance which moves at the same speed as the EOF, as the EOF, therefore, the negative peak of the water (due to its lower absorption compared with the buffer) was used as a neutral marker.
The electrophoretic mobilities are calculated through the following equations:
where; LD: capillary length until the detector (cm); tm: migration time (s) and teo: migration time of the electroosmotic flow (s).
The analysis of results is shown in Table 4 where effective mobilities of EOF and HA obtained with Ec. 2 and 3 are show in Table 3. The effective migration times are shown to give an idea of the precision on the identification of the HA peaks.
Table 4 Electroosmotic and HA mobilities and the effective migration time of HA.
| Mobility (cm2 N *seg) | Effective migration time of the HA | |||
|---|---|---|---|---|
| Inhibitor | OEF | HA | (s) | (min) |
| 318 | 5.06x10 -4 | 2.29x10 -4 | 204 | 3.4 |
| 319 | 4.33x10 -4 | 1.89x10 -4 | 241 | 4 |
| 322 | 4.85x10 -4 | 2.02x10 -4 | 218 | 3.6 |
| 328 | 5.26x10 -4 | 2.32x10 -4 | 198 | 3.3 |
| 329 | 4.95x10 -4 | 2.14x10 -4 | 212 | 3.5 |
| Captopril | 4.76x10 -4 | 1.79x10 -4 | 229 | 3.8 |
| Without inhibitor | 4.93x10 -4 | 1.98x10 -4 | 217 | 3.6 |
| Average | 4.88x10 -4 | 2.06x10 -4 | 216 | 3.6 |
Although each of the LQM compounds possess a lower inhibition compared to Captopril, we can find molecular similarities inside the studied compounds. By analyzing Table 3 the percentage of relative inhibition to Captopril, it is observed that the LQM322 compound possess an inhibition close to Captopril because LQM322 compound presents an 86 % of relative inhibitory effectivity. On the other hand, the other compounds showed a relative inhibition that was significantly lower, swinging between 5 % and 36 %. Suggesting that it is not only necessary to have a bis-substituted structure, but the position of these substitutes will also directly impact the activity and its inhibition power. This allows to determine a chemical structure as a head of series to develop a compound which biological activity could be benefited. The LQM322 compound was the compound that presented the major activity, 86.8 % in comparison with Captopril. Aside from its chemical structure, it could also be a compound with antioxidant activity. It was determined that the compounds to be active facing the ACE, require two thiomorpholine rings at the 4 and 6 relative positions, and that having polyphenols at position 1, 2 and 3 increase the inhibition activity. The LQM329 also have two tiomorpholine rings and two hydroxyl groups, however this compound does not have those substituents at the same positions, this slight modification drastically modify the biological activity. This behavior could be labeled as an activity cliff.
The information reported in the patent derived from the synthesis and the in vivo rat studies [33], describes the compounds as substances that have a cardio protective and antiarrhythmic activity. It has also been found in this patent, that the dose of LQM compounds is less than that dose in the Captopril.
Concluding remarks
The performance and precision of the in-line reaction of the ACE and its HHL substrate through CZE was achieved. The calibration curve was performed for the quantification of HA (product of the reaction) to determine the inhibiton power of the studied compounds, using Captopril as a reference.
Through the CE method, it is confirmed that the compounds of the LQM300 series act on a level of inhibitors of the ACE being the LQM322 compound (3,5-bis(thiomorpholin-4-ylmethyl)pyrogallol) the most active inhibitor with an 86.8 % percentage of effectivity compared with Captopril, while the less active is LQM320 with an activity of 5.1 % in comparison to Captopril. This allow us to have a closer understanding of the necessary molecular characteristics for the design of a compound that allows to inhibit this enzyme. Suggesting that not only it is necessary to have a bis-substituted structure, but also that the position of the bis-substitued structure will directly impact the activity and its inhibitor power. Finally, it was determined that the compounds, in order to be active in front of the ACE, require two thiomorpholine rings and a phenol nucleus, allowing to confirm the inhibition activity of the LQM300 series of compounds with the ACE, which is according with previous computational studies reported.

