


 nueva página del texto (beta)
 Inglés (pdf)
 Artículo en XML
 Referencias del artículo
 Enviar artículo por email
 Citado por SciELO
  Similares en
SciELO
Similares en
SciELO 
 Permalink
Introduction
Recently, nano-sized transition metal oxides have been so attractive in gas sensors, magnetic memory systems, catalysis and opto-electronic device technology due to the improvement of their physical and chemical properties below 100 nm compared to bulk counterparts [1]. The development of magnetic devices can accelerate with the ability to adjust the magnetic moment gained by taking advantage of the improved magnetic properties of nano-dimensional transition metal oxides. Because transition metal oxides such as NiO, FeO, CoO and MnO exhibits both superparamagnetism (SPM) and weak ferromagnetism (FM), their magnetic ordering must be maintained even at room temperature (RT) [2].
Among them NiO, naturally p-type transition metal oxide, is paramagnetic above the Neel temperature of 523 K and exhibits antiferromagnetism, which is useful in spin valve systems [3]. Interestingly, NiO is a prototype material used in both ferromagnetic and antiferromagnetic spintronics, and the crystallization size and morphological shape can be arranged by adjusting production parameters. [4]. In order to overcome problems restricting the scope of NiO in magnetic applications, whose intrinsic initial magnetic properties are insufficiently understood, doping and calcination have been studied due to increasing surface area/volume ratio, improvement of dispersion and decreasing agglomerative formations on the surface [5,6].
On the other hand, because of the high optical transparency, superhydrophobic and cytotoxic properties of SiO2 (silica), they have been used in different application fields such as optoelectronic devices, self-cleaning materials and drug delivery systems [7]. Although SiO2 used as a support material in the catalysis studies, there is no work has been observed in SiO2 supported NiO in the magnetization studies according to our knowledge until now in the literatüre [8]. However, Husain and co-workers explained that SiO2 coated Fe3O4 exhibited enhancing magnetism due to non-toxic properties of SiO2[9].
In chemical nanoparticle production methods, co-precipitation provides simplicity, no set-up system and cheapness compared to other techniques such as chemical vapor synthesis, micro-emulsion and hydrothermal synthesis [10]. It may prevent multi-material usage and leads to expensive processes and complex chemical reactions [11].
The main objective of this study was to produce high quality SiO2 supported NiO magnetic nanoparticles and investigate chemical properties by adding the benefits of spectroscopic methods.
Experimental
All chemicals were analytical grade and used without any further purification. NiO nanoparticles synthesized by co-precipitation method. Nickel (II) chloride (Sigma Aldrich, 99 %) and silica gel (MERCK, 99 %) were used as nickel and silicon sources. NH4OH (25 %, Sigma Aldrich) was used as a complex agent. In 100 ml. DI water, silica gel and nickel source were dissolved and mixed on the magnetic stirrer. Alkaline (pH=10) aqueous solution was obtained with ammonia addition. Molar ratio of silica gel: NH4OH was kept 2:1 and 1:1 to obtain NS1 and NS2 coded samples. Working temperature and working time were Tworking= 80± 5 ºC and tworking=30 minutes. Then, obtained green gels were washed several times with distilled water, ethanol and acetone. After one day waiting to precipitation all samples calcined at 500 ºC and 600 ºC for 90 minutes in the furnace to reduce surface impurities. Codes of samples were NS1-500, NS2-500, NS2-500 and NS2-600.
Crystalline phases and structural parameters were determined by Rigaku SmartLab x-ray diffractometer (XRD) employing CuKα (1.5406 Å) radiation, it was operated under 40 mA and 45 kV. JEOL JSM- 7100F-SEM (Scanning Electron Microscope) was used to investigate surface morphologies under high magnification ratio (x30000). Elemental microanalysis (wt %) of nanocomposites was determined by OXFORD Instruments X-Max EDS (energy-dispersive X-ray spectrometer) which had been attached to SEM. Magnetic properties were characterized by Lake Shore 7407 model VSM (Vibrating samples magnetometer). Photolouminescence (PL) measurement of the samples were recorded by using Shimadzu RF-5301 PC under the excitation wavelength of 250 nm. FTIR spectra was recorded by VERTEX 70 model spectrophotometer with an attenuated total reflectance (ATR) accessory ((Bruker, Germany) in the solid phase, detecting between 4000 cm-1 and 400 cm-1.
Results and discussion
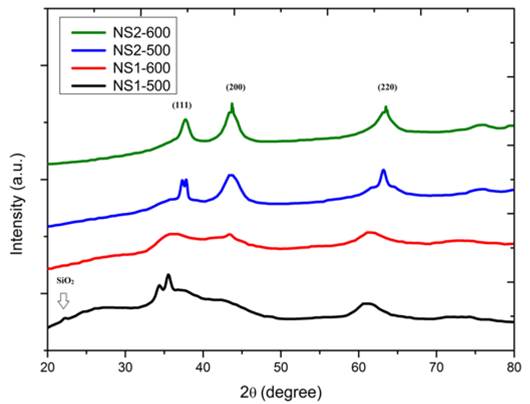
In Fig. 1, X-ray patterns of the NS particles have been shown and no separated narrow x-ray patterns are observed in the 2θ= 20º-80º range. It is clear that the particles are nanometer dimension with the broadening of the peaks [12]. No secondary phase, such as Ni (OH)2 phase formed by the interaction of Ni2+ ions with O2- ions, is determined. Although NS1 samples have poor crystallinity, NS2 samples have polycrystalline cubic NiO phase corresponding to (111), (200) and (220) (JPDS Card No: 47-1049). It can be seen that as the peak width decreases and the density becomes sharper for the (200) and (220) peaks, it occurs with a further structural improvement in the calcination temperature of 600º [13]. Low SiO2 solubility and not completely reduced of nickel-source in growth process cause a poor NiO crystallinity of NS1 samples that have weak SiO2 amorphous peak at 2θ=22.5°, especially in NS1-600 samples [14].
In Table 1, structural parameters of NS2-500 and NS2-600 samples are shown. To determine crystalline size of the particles Debye Scherrer formulation is expressed by Equation (1);
Table 1 Structural parameters of NS2 samples.
| Sample Name | Ni(Atomic weight)(w %) | O (Atomic weight)(w %) | Si (Atomic weight)(w %) | C (Atomic weight)(w %) |
|---|---|---|---|---|
| NS1-500 | 19.57 | 42.46 | 1.15 | 36.81 |
| NS1-600 | 30.96 | 32.22 | 11.49 | 25.33 |
| NS2-500 | 29.63 | 36.79 | 5.01 | 28.56 |
| NS2-600 | 26.94 | 25.34 | 23.92 | 23.80 |
where
Lattice strain decrease is observed by increasing calcination temperature from 500º to 600º, indicating crystal volume stability is improved by decreasing crystalline size.
The lattice parameter formula (a) of the NS2 samples is as follows;
The surface morphology and surface dimensions of the samples are investigated by SEM, as shown in Fig. 2((a-d)). All samples have granular shaped particles. They have been uniformly distributed in NS1-500 samples, it has been degraded with agglomerative forms in samples at 600 ºC. In NS2 samples, their dimensions decreases with increasing calcination temperature from 500 ºC to 600 ºC which is in aggrement with structural parameters in Table 1. Doubling of nickel concentration, surface becomes rougher with donating Ni-alloy clusters. It may be cause an increase local impurity regions [16]. It is well known that general impurities are ferromagnetically combined with the matrix, which can contribute to ferromagnetism [17].
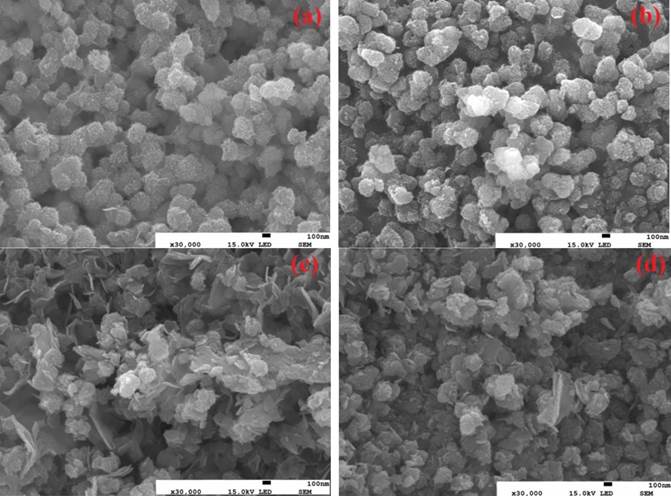
Fig. 2 Surface morphologies of the synthesized NS samples, (a) NS1-500, (b) NS1-600, (c) NS2-500 and (d) NS2-600.
Elemental analysis of the samples exhibits the peaks corresponding to Ni, O and Si, as seen in Fig.3. Atomic weight of the samples are shown in Fig. 3, Table 2.
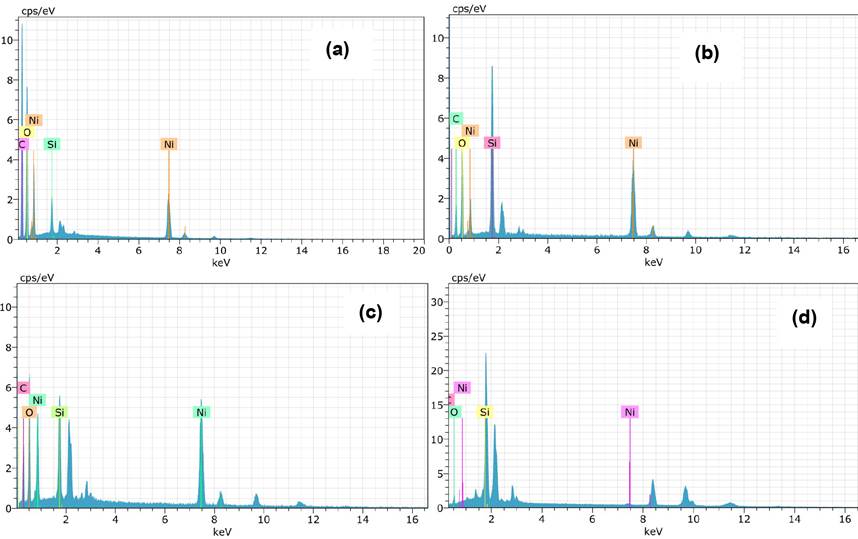
Table 2 Atomic weight ratios (w%) of NS samples.
| Sample Name | Ni(Atomic weight)(w %) | O (Atomic weight)(w %) | Si (Atomic weight)(w %) | C (Atomic weight)(w %) |
|---|---|---|---|---|
| NS1-500 | 19.57 | 42.46 | 1.15 | 36.81 |
| NS1-600 | 30.96 | 32.22 | 11.49 | 25.33 |
| NS2-500 | 29.63 | 36.79 | 5.01 | 28.56 |
| NS2-600 | 26.94 | 25.34 | 23.92 | 23.80 |
In 350-700 nm. range, Fig.4. shows the effect of nickel concentration and calcination temperature on the normalized PL spectra of all samples photo-excited by using 250 nm laser. All samples exhibits emission peaks which is attributed to localized structural defects and off-stoichiometry between 400 nm and 700 nm range [18]. Deep level emission (green emission) is observed at 505 nm for all samples due to localized surface impurities such as oxygen vacancies or nickel intersitial sites [19]. Nickel vacancies as a function of nickel concentration have been observed to cause an increase in PL intensities of green emission. It is known that as a p-type NiO (un-doped) has oxygen excess with the charge transfer between Ni+2 and Ni+3 so Ni vacancies can occur [20]. The emission intensity of wavelengths are the same at 580 nm and 610 nm, corresponding yellow-green emission which is attributed to nickel vacancies [21]. Although NS1 samples have similar emission peak position at 505 nm (2.45 eV), the intensity of emission increases in NS2 samples especially in NS2-600 samples. It is also seen in previous similar studies that grain size has a large effect on emission peak intensity for measured NS2 samples, as shown in Fig. 3 [22].

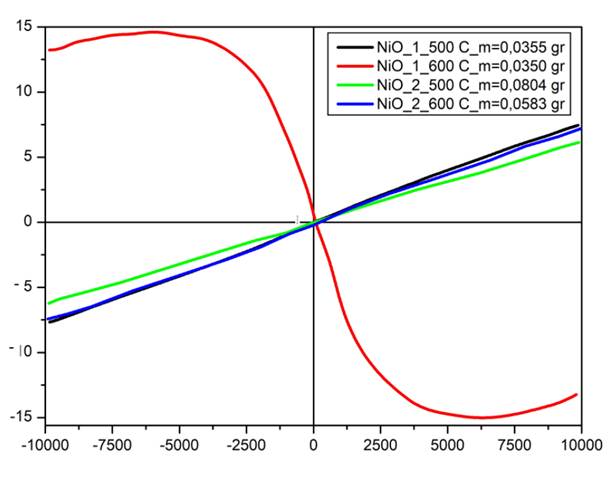
Fig. 5 illustrated the dependence of magnetic field (-1 T to 1 T) on the magnetization curves (M) at room temperature for NS series samples. NS2 samples and NS1-500 particles show linear response to the applied magnetic field with diamagnetism and loops pass through the origin. It is shown that observed high NiO crystallinity with nickle clusters in NS2 samples have improved effect on the NiO magnetism. Ferromagnetic and diamagnetic interaction may be contribute magnetic properties by uncompansated magnetic spins including nickel ions in magnetic systems that similar attitude was investigated for metal doped ZnO particles in our previous study [23]. In addition, surface defects may ensure contribution an increase magnetization with observed green band emission in Fig. 4 [24]. Unlike other samples, NS1-600 samples show ferrimagnetism due to non-magnetic nature of SiO2. This indicates particles are not high pure due to probably SiO2/Ni surface interaction or SiO2 may have provided the surface spin disordered effect [25]. Saturation magnetization and coercivity increases by the increase of calcination temperature 500º to 600º for NS2 samples.
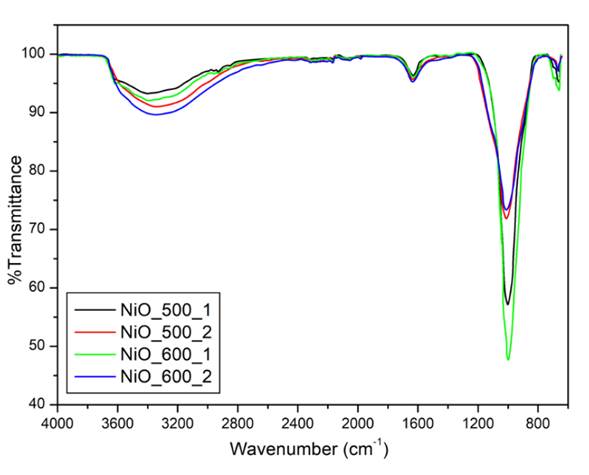
In Fig. 6, FTIR spectrum of the samples was shown to investigate chemical composition of the samples, recording in the range between 4000-500 cm-1. All samples have similar functional groups with different peak intensities. The broad peak at about 3360 cm-1 and the sharp peak 1550 cm-1 in all samples can be attributed to the O-H stretching vibration mode and H-O-H bending vibration mode, respectively. H-O-H bending vibration peak intensities much more sharper in NS1 samples due to the increasing presence of traces of water [26]. The weak peak in the wavenumber region of 500 ∼ 750 cm-1 is observed due to the combination Ni-O and Si-O bonds, indicating a cross network is formed in all samples [27].
Conclusion
Particle-based NiO/SiO2 structures were synthesized by simple co-precipitation. Magnetic and photoluminescence properties as well as structure and surface morphology of the samples were investigated. From x-ray patterns, to obtain high NiO crystallinity nickel concentration and calcination temperature were arranged as double nickel cocentration at 600 ºC. Deep level emission intensity increases with decreasing average grain size for double nickel cocentration samples. Amorphous SiO2 may be contribute room temperature ferromagnetism although it can be prevent growth process of NiO. Due to room temperature ferromagnetism and green emission properties, SiO2 supported NiO structures should be used in non-volatile memory devices

