


 nueva página del texto (beta)
 Inglés (pdf)
 Artículo en XML
 Referencias del artículo
 Enviar artículo por email
 Citado por SciELO
  Similares en
SciELO
Similares en
SciELO 
 Permalink
1. Introduction
Jalisco state, placed in Mexico, has the most representative cluster of Information Technologies Sector located into the Metropolitan Zone of Guadalajara, Mexico (ITSMZG), home of the Mexico’s “Silicon Valley”. The ITSMZG is dedicated to develop new technologies in: design software, TV, cinema, advertising to videogames, digital animation, interactive multimedia and e-learning, among others. It has around 200 IT firms that exports 2,000 billion usd annually on high value-added services, almost a third of the national total. The ITSMZG generates 20,000 jobs in the state, while coupled entire electronics industry, the workforce exceeds 100,000 posts (Economista, 2016). The ITSMZG, is characterized by the high OBM practices, so they are interested to analyse all the determinant factors related to improve all about the OBM process. The ITSMZG knows several aspects of OBM and their practices, so they need an empirical scale model as a first settlement to be adapted and applied.
2. Problem, Rationale of the Study and Hypotheses
The problem is proposed as a general question (GQ): Which are the determinant factors of OBM as an empirical model for the ITSMZG? The rationale of the study is due to the interest of the ITSMZG to know how measure the main variables of OBM process to do suggestions for the improvement of the model.
To solve the problem, we posed the next specific questions (SQ):
SQ1.-Which are the variables proposed for the general conceptual model?;
SQ2.-Which are the relationships of these variables?;
SQ3.-Which are the most relevant variables of the model?
3. Literature Review
Since the first years of the XXI century, for the academic and the professional world, there has been a frequent mention of the term “business model”. Specially today, that digital media in access and transmission data offer the great possibility of being networked (anywhere, any-time) managers and academics have speculated about which business models have led to spectacular successes and which have been used by organisations that have withered and died. The question of which business models are effective in this age of fast and dramatic change clearly occupies the minds of many. The business models have surged into the management vocabulary. But, there is still a lot of confusion about what business models are and how they can be used. The main facts, is that they are an strategical reference and have a powerful role in corporate management. While other authors have recently offered definitions of business model, none appear to be generally accepted (Shafer et al.,2005). Likewise steadily pace, the concept has been evolving as far the open innovation has been implemented by the firms due internet and information technologies. However, the authors show different definitions and point of views about what OBM is, therefore the objective of this article is to propose a framework for OBM.
We made a documentary study to determine the open business models factors (OBM), among 97works from 1998 (Shafer et al., 2005) until nowadays (Weiblen, 2014), selecting 26 documents (from 2006 until 2016) with detailed description about OBM. See Table 1.
Table 1 Open Model Business definitions

Note: VPR. Value proposition; MKS.Market segmentation; TECM.Tecnology based on market; TECP. Tecnology based on policies of the firm.; SOBM.Strategy on OBM.; IPR.Intellectual property rights; ORBM.Orientation of OBM.; SIPR.Strategy on IPR.; GOV.Governance; PTF.Platform-Channels.; PTS.Partenrship.; KR.Key resources; CRM.Customer relationship management; RIPR.Revenues per IPR; KA.Key activities; LST.Lean stat-up.; CST.Cost structure.
Source: Weiblen (2014) updated with own adaption.
With these results, we proceeded to detect the more relevant variables by mean of a variable standardization by concept, in order to gather them in little common groups according the open business definitions. This represents the academic vision. See Table 2.
Table 2 OBM Variables mentioned for each author analyzed
| Item | Variables | Authors numbered as the Table 1 | TOT | |||||||||||||||||||||||||
|---|---|---|---|---|---|---|---|---|---|---|---|---|---|---|---|---|---|---|---|---|---|---|---|---|---|---|---|---|
| 1 | 2 | 3 | 4 | 5 | 6 | 7 | 8 | 9 | 10 | 11 | 12 | 13 | 14 | 15 | 16 | 17 | 18 | 19 | 20 | 21 | 22 | 23 | 24 | 25 | 26 | |||
| 1 | CRM | X | X | 2 | ||||||||||||||||||||||||
| 2 | CST | X | X | 2 | ||||||||||||||||||||||||
| 3 | GOV | X | X | X | X | X | X | X | 7 | |||||||||||||||||||
| 4 | IPR | X | X | X | X | 4 | ||||||||||||||||||||||
| 5 | KA | X | X | X | X | X | 5 | |||||||||||||||||||||
| 6 | KR | X | X | X | X | X | X | 6 | ||||||||||||||||||||
| 7 | LST | X | X | X | 3 | |||||||||||||||||||||||
| 8 | MKS | X | 1 | |||||||||||||||||||||||||
| 9 | ORBM | X | X | X | X | X | X | X | X | X | X | X | 11 | |||||||||||||||
| 10 | PTF | X | X | X | X | X | X | X | X | 8 | ||||||||||||||||||
| 11 | PTS | X | X | X | X | X | X | 6 | ||||||||||||||||||||
| 12 | RIPR | X | X | X | X | 4 | ||||||||||||||||||||||
| 13 | SIPR | X | X | X | 3 | |||||||||||||||||||||||
| 14 | SOBM | X | X | X | X | X | X | X | X | X | X | X | X | X | 13 | |||||||||||||
| 15 | TECM | X | X | 2 | ||||||||||||||||||||||||
| 16 | TECP | X | X | X | X | X | X | 6 | ||||||||||||||||||||
| 17 | VPR | X | X | X | X | X | X | X | X | X | X | X | X | X | X | X | X | X | 17 | |||||||||
| 10 | 10 | 3 | 1 | 4 | 4 | 3 | 3 | 5 | 1 | 4 | 5 | 2 | 6 | 4 | 2 | 3 | 2 | 2 | 2 | 3 | 3 | 5 | 7 | 3 | 3 | |||
| TOTAL | 100 | |||||||||||||||||||||||||||
Notes: CRM.Customer relationship management; CST.Cost structure; GOV.Governance; IPR.Intellectual property rights; KA.Key activities; KR.Key resources; LST.Lean start-up ; MKS.Market segmentation; ORBM.Orientation of OBM.; PTF.Platform-Channels.; PTS.Partenrship; RIPR.Revenues per IPR; SIPR.Strategy on IPR.; SOBM.Strategy on OBM.; TECM.Tecnology based on market; TECP. Tecnology based on policies of the firm; VPR.Value proposition.
Source: Own.
This vision was faced to the empirical point of view (empirical vision) of 5 renowned specialists at ITSMZG in the practice of OBM. Using AHP technique (Saaty, 1997) and Focus Group Delphi´s Oracle we weighed and determined the most important variables to use in our conceptual model. Even more, the specialist recommended 5 underlying factors, for best variables grouping to explain the OBM: business management BMG, strategy (STR), technology (TEC), new entrepeneurships (NWE) and open innovation orientation (OIO). See Table 3.
Table 3 AHP or Saaty’s Theorem to identify variables and factors of OBM
| Objective | Open Business Model (OBM) | ||||
|---|---|---|---|---|---|
| Alternatives | Factor as Empirical vision | Variable as Academic vision | Frecquency as Academic vision | AHP weighing as an empirical vision | |
| BMG | 1 | VPR | 17 | 0.1 | |
| STR | 2 | SOBM | 13 | 0.09 | |
| OIO | 3 | ORBM | 11 | 0.09 | |
| BMG | 4 | PTF | 8 | 0.08 | |
| OIO | 5 | GOV | 7 | 0.08 | |
| BMG | 6 | KR | 6 | 0.07 | |
| BMG | 7 | PTS | 6 | 0.07 | |
| TEC | 8 | TECP | 6 | 0.07 | |
| BMG | 9 | KA | 5 | 0.07 | |
| NWE | 10 | IPR | 4 | 0.06 | |
| BMG | 11 | RIPR | 4 | 0.06 | |
| NWE | 12 | LST | 3 | 0.05 | |
| STR | 13 | SIPR | 3 | 0.04 | |
| BMG | 14 | CRM | 2 | 0.03 | |
| BMG | 15 | CST | 2 | 0.02 | |
| TEC | 16 | TECM | 2 | 0.01 | |
| BMG | 17 | MKS | 1 | 0.01 | |
| TOTAL | 100 | 1.00 | |||
Notes: BMG. Business model generation; CRM.Customer relationship management; CST.Cost structure; GOV.Governance; IPR.Intellectual property rights; KA.Key activities; KR.Key resources; LST.Lean start-up ; MKS.Market segmentation; NWE.New entrepeneurship; OIO. Orientation of the innovation; ORBM.Orientation of OBM.; PTF.Platform-Channels.; PTS.Partenrship; RIPR.Revenues per IPR; STR. Strategy; SIPR.Strategy on IPR.; SOBM.Strategy on OBM.; TEC. Technology; TECM.Tecnology based on market; TECP. Tecnology based on policies of the firm; VPR. Value proposition.
Source: Own.
So, we started to describe the underlying factors (BMG, STR, TEC, NEW, OIO) grouping our variables with their principal features, under the OBM vision, as:
3.1 Open Business Model (OBM) Factor
With the increased adoption of open innovation practices, “open business models” (OBM) have emerged as a new design theme (Chesbrough, 2006). As we’ve see, exist a lot of definitions to be analyzed depending the point of view of the researcher, for example Weiblen (2014) refers in its study of open business model definitions, among 13 papers and three groups of concepts: “a) Same: for seven of the papers, it was not possible to spot a notable difference between open innovation and open business model. The concepts are used almost synonymously .b)OBM = BM based on OIN: in two of the papers, the authors see a firm using open innovation principles as one that implements an open business model but the differentiation is made. c) OBM = BM adjusted to OIN: four papers adopt a slightly different standpoint. Here, certain adjustments to the firm’s business model have to be made to accommodate for the incorporation of open innovation into R&D.
As the last two groups show, there is a slight difference in meaning, but the border between open innovation and the open business model concept is hard to draw. Before taking up this point in the discussion of the results, the remaining papers of the literature base, which take a broader perspective on the open business model, are presented.”
Despite the mentioned above, to facilitate our point of view of conceptual OBM, in this paper, we porpose to use the Osterwalder & Pigneur (2010) definition of business model: “A business model describes the rationale of how an organization creates, delivers, and captures value”. If we see the Table 4 we found out in an implicit form ,the 9 blocks of the Osterwalder & Pigneur’s (2010) model: VPR, MKS, PTF, KA,KR,CRM,RIPR,CST and therefore we can call these group of variables the business management (BMG) factor. Although some authors, such as Euchner and Ganguly (2014) comment about this part of the model: “it misses the key dynamic elements of working business models- it does not represent coherence (or the relationshipamong elements); it does not represent the competitive position (which is off the canvas); and it does not quantify the economic leverage points”.But, we consider that it can be well complemented, with the remaining variables which are grouped, as follows: TECM, TECP variables group we can call as a tecnology (TEC) factor; SOBM, SIPR variables group as a strategy (STR) factor; IPR, DIV variables group we can call as a new entrepeneurships (NWE) factor and finally, ORBM, GOV variables group we can call as a open innovation orientation(OIO) factor.
Table 4 The Business Model Model Generation as Business Model Management Factor
| PTS | KYA | VPR | CRM | MKS |
| KYR | PTF | |||
| CST | RIPR | |||
Note: CRM.Customer relationship management; CST.Cost structure. ; KA.Key activities; KR.Key resources; MKS.Market segmentation; PTF.Platform-Channels; PTS.Partership; RIPR.Revenues per IPR; VPR. Value proposition;
Source: Osterwalder & Pigneur (2010) with own adaption
3.1.1 The Business Model Management (BMG) Factor
As we mention above, this article is based and adapted to the Osterwalder & Pigneur (2010) model, more recognized as Business Model Generation. See Table 4.
The proposed conceptual OBM is adapted and explained as follows:
-The market segmentation (MKS) as the basis to define the services and products specialized to offer to the customer according Osterwalder & Pigneur (2010) and being: mass market, niche market, segmented market, diversified market, multi-sided platforms (or multi-sided markets). The key questions to be solved are: For whom are we creating value? Who are our most important customers?. It represents the opportunity to analyze, different application of the technology besides the current market such as the discovering and developing new markets or for licensing other firm’s market (Osterwalder & Pigneur, 2010; OECD, 2008).
-The value proposition (VPR) is the core of any business and is characterized by: newness, performance, customization, “getting the job done”, design, brand status, price, cost reduction, risk reduction, accesibilty, convenience /usability. The key questions to be solved: are: what value do we deliver to the customer? which one of our customer’s problems are we helping to solve?, which customer needs are we satisfying?,what bundles of products and services are we offering to each Customer Segment? (Osterwalder & Pigneur, 2010). The model includes the user a source of innovation to create value, as a tool to capture value (Von Hippel 2005). A growing number of research and development-driven companies are located in knowledge-based ecosystems. Value creation by these ecosystems draws on the dynamics of single firms (interacting and partnering) as well as the ecosystem at large (Van der Borgh et al. 2012).
-The customer relationship management (CRM). This section describes the types of relationships it wants to establish with specific customer segments, being for instance: personal assistance, dedicated personal assistance, self-service, automated services, communities, co-creation. Special attention represents the co-creation relationship because in the world of Web 2.0 has considerably increased the possibilities of user involvement in the production process and, thereby, has given rise to new forms of co-creation (OBM with customers). Because the roles of consumers, (or prosumers) have radically changed, specific challenges have emerged, being the main challenges: incentives, risks and costs, IPRs. (Rayna & Styriukova, 2014).The types of relationships might be driven by the following motivations: .customer acquisition; customer retention; .boosting sales (upselling). It includes key questions to be solved: through which channels do our customer segments want to be reached?, how are we reaching them now?, how are our channels integrated?, which ones work best?,which ones are most cost-efficient? how are we integrating them with customer routines? (Osterwalder & Pigneur, 2010).
-The channels based on platforms (PTF). This block describes how a company communicates with and reaches its customer segments to deliver a value proposition. It´s used for raising awareness among customers about a company’s products and services, helping customers evaluate a company’s value proposition allowing customers to purchase specific products and services delivering a value proposition to customers and providing post-purchase customer support. It involves key questions to be solved: through which channels do our customer segments want to be reached? , how are we reaching them now? , how are our channels integrated? which ones work best?,which ones are most cost-efficient?, how are we integrating them with customer routines? . It´s highly recommended, to be close to customers and providers follow the channel fases, such as: awareness, evaluation, purchase, delivery and after sales with the own (or with partners) resources and capabilities (Osterwalder & Pigneur, 2010; OECD, 2008).
-The revenues streams (RIPR) is adapted from the original Osterwalder & Pigneur (2010) model representing the cash a company generates from each customer segment (costs must be subtracted from revenues to create earnings) specially differenced here, from IPR due the intellectual capital of the firm (mainly based on technology) and taking different forms, such as: assets sales, usage fee, subscription fee, lending/renting/leasing, licensing, brokerage fees, advertising, and several forms of pricing (static/dynamics) (Osterwalder & Pigneur, 2010).This variable represents a great chance, for the organizations based on de IPR protection as: patents, trademarks and copyrights, for commercialising them using patent pools or cross-licensing portfolios, for instance (OECD, 2008).Based on IPR, some key question to be solved are: for what value are our customers really willing to pay?, for what do they currently pay?, how are they currently paying?, how would they prefer to pay?, how much does each RIPR contribute to overall revenues?
-The key resources (KYR). In OBM there’s no more the most important assets required to make a business model work (Chesbrough, 2006) due the capability of the firm to access to the external resources of its partners. But every OBM, requires it. These resources allow an enterprise to create and offer a VPR, reach markets, maintain relationships with MKS, and earn revenues involving tangible (buildings, infrastructure, labs, etc) and intangible (data, information, talent personnel, etc.) assets. KYR can be physical, fi nancial, intellectual, or human; also can be owned or leased by the company or acquired from key partners (Osterwalder & Pigneur, 2010). Some key questions to be solved are: what key resources do our value propositions require? , our distribution channels? customer relationships?, revenue streams based on IPR? If we opening up, we see that a conceptual OBM might includes various perspectives: (1) globalization of innovation, (2) outsourcing of R&D, (3) early supplier integration, (4) user innovation, and (5) external commercialization and application of technology (Gassman, 2006) in own or partners labs (Asakawa et al. 2010) to apply the KYR in optimal conditions
-The Key Activities (KYA) there’s no more the most important assets required to make a business model work (Chesbrough, 2006) due the capability of the firm to access to external activities of its partners. It describes the most important things a company must do to make its OBMs work as the most important actions a company must take to operate successfully. They are required to create and offer a VPR, reach markets, maintain CRM, and earn revenues. Some key activities for instance are: production, problem solving and platform network. Key questions to be solved are: what key activities do our value propositions require?, our distribution channels?, customer relationships?, revenue streams? (Osterwalder & Pygneur, 2010). For instance, about the key activities involving knowledge, exists an spatial clustering of economic activity and its relation to the spatiality of knowledge creation in interactive learning processes. It questions the view that tacit knowledge transfer is confined to local milieus whereas codified knowledge may roam the globe almost frictionlessly. Some studies highlight the conditions under which both tacit and codified knowledge can be exchanged locally and globally (i.e. cluster and network innovation systems) (Bathelt et al. 2004). There is currently a broad awareness of OBM and its relevance to corporate R&D. The implications and trends that underpin OBM are actively discussed in terms of strategic, organizational, behavioral, knowledge, legal and business perspectives, and its economic implications as key activities (Enkel et al. 2009). Previous studies have firmly established the technological gatekeeper to be a key node in the innovation process as key activities (acquiring, translating, and disseminating external information throughout the R&D unit) (Whelan et al. 2010). Besides, several studies argue that a key activity of a firm is to recognize the value of new, external information, assimilate it,and apply it to commercial ends is critical to its innovative capabilities (Cohen & Levinthal, 1990; OECD, 2008) called commonly as absorptive capacity in an OBM. Some special conditions for instance, the pool of scientist, clusters and academic institutes, near to markets and production facilities are key factors to do investments for activities aimed to R&D, in other countries (Schwaag 2006; INSEAD et al., 2006). Companies base their decisions to locate R&D as the key activities on a variety of factors, principally: market potential, quality of R&D staff, university collaboration, and intellectual property protection. While lower cost can be a consideration (i.e. outsourcing) this is generally less important than other factors. (Thursby & Thursby 2006; Kuemmerle 1997; Dunning & Narula 1995). Exists acknowledge that some degree of outsourcing can further corporate creativity and that virtuality makes sense under certain conditions. But every company, they contend, needs to tailor its organization to its own operations and its unique sources of innovation (Chesbrough & Teece, 2002).
-The Partnerships (PTS) represent the network of suppliers and partners that make the business model work companies forge partnerships for many reasons, and partnerships are becoming a cornerstone of many business models. Companies create alliances to optimize their business models, reduce risk, or acquire resources. There are four diffeerent types of partnerships: a) Strategic alliances between non-competitors, b) Coopetition: strategic partnerships between competitors; c) Joint ventures to develop new businesses; d) Buyer-supplier relationships to assure reliable supplies (Osterwalder & Pigneur, 2010). The motivations to do it are: reduction of risk and uncertainty, optimization and economy of scale, acquisition of particular resources and activities. Our conceptual OBM is completely supported by partnership especially in the partnership with sub-national or regional innovation systems (OECD , 2008b; Cook, 2005; Beckan et al. 2004) as well as the relationship of University-Government-Organization (Triple Helix) (Etzkowitz & Leydesdorff, 1995), and recently, the society (Miller et al. ,2016).
-The cost structure (CST) determines all costs incurred to operate the OBM. Creating and delivering value, maintaining customer relationships, and generating revenue all incur costs. Such costs can be calculated relatively easily after defining KYA, KYR, and PTS. There are several types of costs, such as: cost-driven, value-driven, fixed costs, variable costs, economies of scale, economies of scope. Some questions to be solved are: what are the most important costs inherent in our OBM?, which KYR are most expensive?, which KYA are most expensive?. Some authors (Remneland-Wikhamn & Knights, D. 2012) have called thistransaction cost economics (TCE) and consider that has had a strong impact on theories of economic exchange but also on OBM, even though the relationship is often implicit rather than explicit. The key questions to be resolved are: who are our key partners? who are our key suppliers?, which key resources are we acquiring from partners?, which key activities do partners perform?
Hence, our hypothesis is:
H1. Higher level of BMG higher level of OBM at ITSZMG.
3.1.2 The Strategy (STR) Factor
The strategy (STR) in regard of the match to OBM is likely to be an important antecedent to open innovation performance, because the “… essence of a business model is in defining the manner by which the enterprise delivers value to customers, entices customers to pay for value, and converts those payments to profit” (Teece, 2010). These set of manners are proposed in our model to be implemented as:
SOBM.- Which is aimed to determine 4 OBM strategies, according Saebi & Foss (2013). See Table 5.
Table 5 Strategies for OBM
| Market-based innovation strategy | Crowd-based innovation strategy | Collaborative innovation strategy | Network-based innovation strategy | |
|---|---|---|---|---|
| Business model dimensions | Efficiency-centric OBM | User-centric OBM | Collaborative OBM | Open platform business model |
| Content | -Efficiency-centered value proposition, enabled by reduction in transaction and coordination costs | .User-centered value proposition, input from communities of users | .Radical innovations and opening up of new target segment | .Business model acts as open-innovation platform for multiple stakeholders |
| Structure | -Redefinition of role of internal R&D system -Efficiency-centered structure | -Ideation phase of innovation process "outsourced" to the crowd | -Users / suppliers / customers / competitors become key partner in innovation process | -Re-organization of the production & distributional system -Need for complementary internal network |
| Governance | -Monetary remuneration for external knowledge provider -Use of “integration experts” to absorb market-available knowledge | - Monetary prizes or recognition for external knowledge providers -Incentives to engage and manage communities of users for own employees | -Contract based, sharing of rewards on organizational level with external knowledge provider -Incentives for own employees to engage with lead users and alliance partners | -Provide incentives for own employees to engage with multitude of knowledge partners (individuals, companies, communities) -Re-distribution of risks & rewards |
Source: Saebi & Foss (2013)
However, it still has a lot to study and learn about the implications of these strategies because, for instance user-centric OBM in the specific context of project-based firms can show negative interactions are related to the client’s attempts to reduce costs through tender-based competition to push down prices, or through contracts that push the risk onto the contractors, owing price competition with negative impact in innovation (Hopkins et al. 2010).
SIPR.- National surveys of R&D labs across the manufacturing sectors in several industrialized countries (i.e. USA and Japan) show that intraindustry R&D knowledge flows and spillovers are greater, and the appropriability of rents due for patents and intelelectual property take an strategical importance for innovation (Coehn et al. 2002). The value of the open innovation approach is now widely recognized, and the practice has been extensively researched, but still very little is known about the relative impact of firm-level and laboratory-level open innovation policies and practices on R&D performance (Asakawa et al. 2010) that most be involved in an OBM, to get competitive advantage (Rohrbeck,et al. 2009). Even more, the secrecy of vital process of the firm must be protected (OECD, 2008).
Hence, our hypothesis is:
H2. Higher level of STR higher level of OBM at ITSZMG.
3.1.3 The Technology (TEC) Factor
It’s one of the most important factors in OBM. It’s an asset that firms use such as: technology in-licensing, technology licensing, and technology out-licensing (Chesbrough & Kardon-Crowter, 2006). Based on the results, we distinguished the next variables around TEC:
TECM.- How the technology is created by the own firm's capabilities and resources, or how the firm uses its own capabilities to do alliances to get external technology and the fact to aim to own market or other markets, represent the core of the open innovation in this matter (Chesborough, 2003) and is strategic integrate it onto the OBM. Besides, acquiring external knowledge, many firms have begun to actively commercialize technology, for example, by means of out-licensing. This increase in inward and outward technology transactions reflects the new paradigm of open innovation. Most prior research into open innovation is limited to theoretical considerations and case studies, whereas other lines of research have focused either on external technology acquisition or exploitation (Lichtenthaler & Holger 2009).
TECP.- Companies have historically invested in large research and development departments to drive innovation and provide sustainable growth. What is emerging is a more OBM, where companies recognize that not all good ideas will come from inside the organization and not all good ideas created within the organization can be successfully marketed internally. To date, Open Innovation concepts have been regarded as relevant primarily to “high-technology” industries. Even more, without knowing it, there are several companies that are already applying many concepts in a wide range of industries (Chesbrough & Kardon -Crowter, 2006). So, it’s an important matter the regulation of how to use the technology, by mean of firm’s policies.
Hence, our hypothesis is:
H3. Higher level of TEC higher level of OBM at ITSZMG;
3.1.4 The New entrepeneurships (NWE) Factor
-The new entrepreneurships (NWE) successfully achieved are a good indicator of any OBM, such as the spin-in, spin-out and spin-off in certain period. Hence, we propose in our conceptual OBM:
-The intellectual property rights (IPR) supported by the activities, policies, process, etc. involved in the firm to create: patents, trademarks and copyrights. The effective management of IP is crucial for identifying useful external knowledge and particularly for capturing the value of a firm’s own IPR; hence, the protection of IPR attracts more attention, especially in emergent countries, because their weak reinforcement. Empirical studies on the impact of IPR of foreign R&D have generally provided evidence that the protection has a positive impact on inward R&D, especially in largest companies. However, the opposite occurs in in the SMEs that they may face greater risk in collaborations with largest companiesbecause they tipically have fewer resources and limited expertise in this issue (OECD, 2008). As we saw, the IPR must be included in our conceptual OBM, because is one of the most important outcomes.
-Lean start-up (LST). It’s a term that brings together the principles of customer development, agile methodologies and lean practices. By using short and frequent cycles for tests and corrections, this approach aims at changing the way firms are built and products are designed, helping companies to succeed in a business landscape riddled with risk. Particularly, it seeks to minimize costs, waste and time to market, giving new products the best possible chance to get off the ground and into the hands of customers. Even though the lean start-up approach is still in an embryonic stage, it has attracted much attention in recent years among entrepreneurs, technologists and investors. Yet, this research topic certainly constitutes and interesting research stream to better understand the process of starting up a new venture. According to Ries (2011), the rationale behind the lean start-up approach is to optimize the utilization of scarce resources by using smaller and faster iterations for testing a vision continuously so as to get a desired product to customers' hands faster. To accomplish this goal, lean start-ups strive to minimize the expenditure of resources for anything but the creation of value for the customer. (Trimi & Berbegal-Mirabent, 2012).
Hence, our hypothesis is:
H4. Higher level of NWE higher level of OBM at ITSZMG
3.1.5 The Open Innovation Orientation (OIO) Factor
-The OI orientation (OIO). We consider is one of the most important factors in our conceptual model, because is here, where the executives can decide at the beginning with the OBM, the course of the firm of in OIN process. To achieve this, we propose
-The orientation of busines model (ORBM). Some studies show that OIN usually falls into lower performance by the definition of how the knowledge flows. In this sense, for OIN is categorized into knowledge exploration, knowledge retention, and knowledge exploitation (Lichtenthaler, 2009). Firms integrate knowledge exploitation and knowledge exploration to maximize their technological capabilities and competencies (Lichtenthaler, 2008). In this sense Chien-Tzu & Wan Fen (2014), summarize that knowledge exploitation reflects: the innovation practices to systematize purposive outflows of knowledge as well as the firm’s behavior to be efficient, implementing and improving the production. By other hand, the knowledge exploration refers to: purposive inflows of knowledge as well as the firm’s behavior for discovering and experimenting due the risks that are being taken. Other exploratory studies have examined the corporate venturing as an effective means of technology acquisition (spinning in) and technology divestment (spinning out) establishing the drivers for, and benefits of, these approaches as strategic tools for deriving greater value from R&D; identifying current good practices; and understanding the barriers to progress (EIRMA, 2003)
-Governance (GOV) might be one of the most important variables due the participants in the OBM process may belong to organizations with different structures and goals. For instance, several large companies with R&D are usually managed through central governance system. Some OBM governance issues that may need to be addressed include ownership and decision rights, issue escalation, organizational estructure, resource commitments and potential timming, termination rights and conditions. Patners may wish to develop operating procedures thainclude standards for collecting, storing and sharing data. Establishing clear roles and responsabilities for collaboration team leaders and members for each step of the joint discovery, development, and delivery process are also important. (Deloitte, 2015). Finally, all governance system must be regulated by rules of ethics. The part of ethics in our conceptual OBM consists of three principal components: expectations, perceptions and evaluations that are interconnected by five sub-components: society expects; organizational values, norms and beliefs; outcomes; society evaluates; and reconnection aspiring (Svensson & Wood, 2007).The model aspires to be highly dynamic due the continuous and an iterative process. There is no actual end of the process, but a constant reconnection to the initiation of successive process iterations of the business ethics of conceptual OBM. The principals and sub-components of the model construct the dynamics of this continuous process. Hence, our hypothesis is:
H5. Higher level of OIO higher level of OBM at ITSZMG
3.1.6 The Key performance Indicators of each factor
It is essential that measurement be timely. Today, a KPI (key performance indicators) provided to management that is more than a few days old is useless. KPIs are prepared in real time, with even weekly ones available by the next working day. Many KPI project teams will also, at first, feel that having only 10 KPIs is too restrictive and may wish to increase KPIs to 30. With careful analysis, that number will soon be reduced to the 10 suggested unless the organization is made up of many businesses from very different sectors; in that case, the 10/80/10 rule can apply to each diverse business, providing it is large enough to warrant its own KPI rollout. In this article we only require to the firms if they use some KPI because most of them are financial and confidential. Hence we propose a KPI for each factor such as: strategy (PSTR), technology (PTEC), business model management (PBMG), new entrepeneurships (PNWE) and finally, open innovation orientation (OIO) (Parmented, 2010). The mentioned KPI’s could establish the relationship between outbound open innovation (indicating an inside-out process) and firm performance. In particular, it suggests that outbound open innovation may have positive and negative effects on firm performance based on potential benefits and risks of transferring technology. To what degree these effects materialize depends on internal factors .Consequently, a proficient internal management of outbound open innovation is critical to avoid its potential risks and to capture its substantial benefits. In this regard, future research may substantially deepen the insights into the relevance and role of outbound open innovation (Lichtenhauler, 2015). In order to promote and ensure the performance of OBM, an assessment framework and the evaluation indicators are required (Chien-Tzu & Wan Fen, 2014). All mentioned above would be serve as a feedback to control the OBM process as an Innovation Busines Model (Mejía et al. 2014).
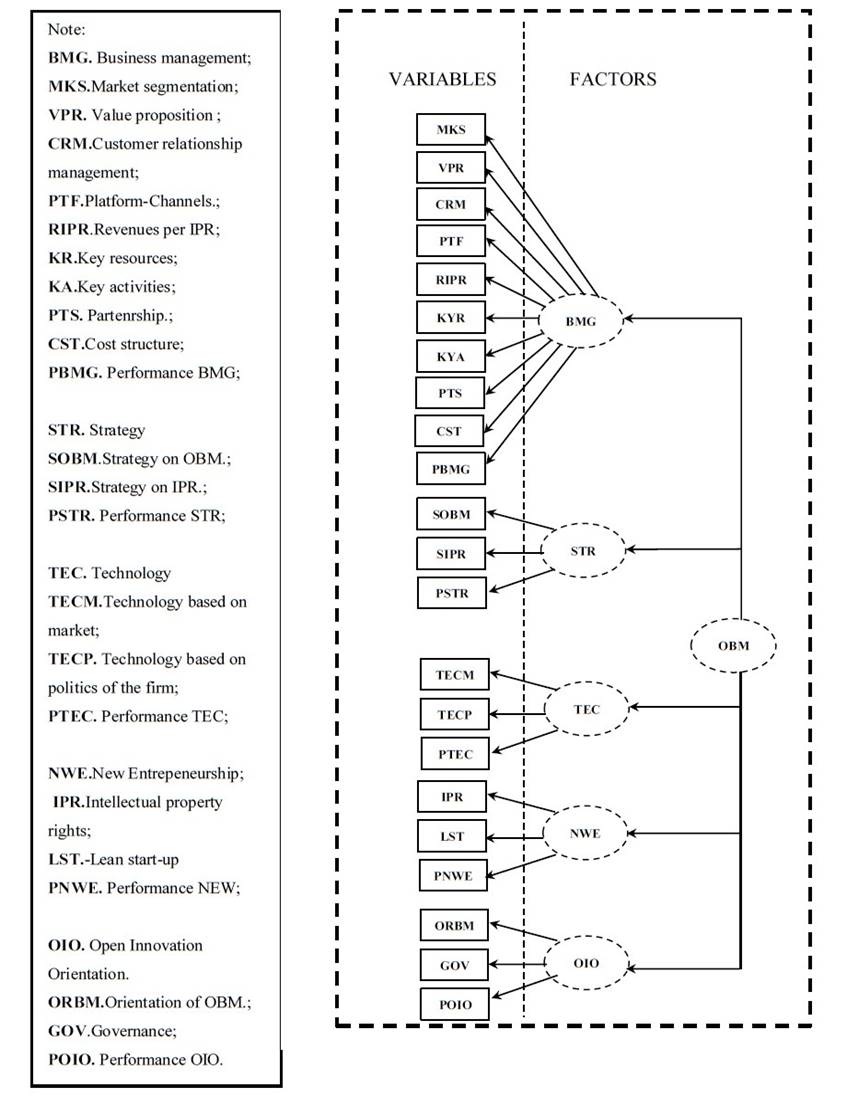
Please, see Scheme 1 for the general conceptual model and the Appendix 1 for the final detailed questionnaire.
4. Method
We show the Table 6 with a summary of the test and values used in this research.
Table 6 Technical Research Data, Test and Values used in this Research
| Technical Research Data | |||
|---|---|---|---|
| Features | Survey | ||
| Universe | 1000 specialists in business design at ITSMZG | ||
| Scope | Metropolitan Zone of Guadalajara, México | ||
| Sample Unit | 600 specialists at ITSMZG ITSMZG involving: 150 IT teachers; 150 representatives of consulting firms; 290 IT SME CEO and 10 IT LE CEO | ||
| Collection Method of Data | e-Mail/ Inquiry | ||
| Scale | Likert 5 | ||
| Date of Fieldwork | January-2015-May-2016 | ||
| Total of interviews | 680 | ||
| Test used in this Research | Value /Description | Author | |
| Ratio NC/VoQ= Number of cases (NC) & Variables Of Questionnaire (VoQ) | NC= 600 (>=100 and <=1000) specialists at ITSMZG VoQ = 22 Ratio NC/VoQ= 600/22=27>10 ( >10 recommended by Hair, 2014) | Hair et al.(2014) | |
| CFA (Confirmatory Factorial Analysis ) by Maximum Likelihood Method, and Covariance Analysis by EQS 6.1 software | To verify the Reliability and the Validity of the Measurement Scales | Bentler, (2006); Brown, (2006); Byrne, (2006) | |
| Cronbach's Alpha (CHA) and Composite Reliability Index (CRI) | CHA (Per Factor Via SPSS) & CRI>=0.7 / Reliability of the Measurement Scales | Bagozzi & Yi, (1988); Nunnally & Bernestain,(1994); Hair et al., (2014) | |
| Mardia’s Normalized Estimate.(M) | M>5.00 / Distributed as a unit normal variate such that large values reflect significant positive kurtosis and large negative values reflect significant negative kurtosis. Bentler (2006) has suggested that in practice, values >5.00 are indicative of data, that are non-normally distributed | Bentler (2006); Byrne, (2006) | |
| The Satorra-Bentler scaled statistic (S-Bχ2) | SBχ2.- By specifying ME=ML, ROBUST, the output provides a robust chi square statistic (χ2) called. This is to minimize the outliers and achieve goodness of fit | Satorra & Bentler, (1988) | |
| Normed Fit Index (NFI) | NFI>=0.8 and <=.89. / Index used for more than two decades by Bentler and Bonett’s (1980) as the practical criterion of choice, as evidenced in large part by the current “classic” status of its original paper (Bentler, 1992; and Bentler & Bonett, 1987, cited by Byrne, 2006). However, NFI has shown a tendency to underestimate fit in small samples, | Bentler & Bonnet,(1980); Byrne (2006) | |
| Comparative Fit Index (CFI) | CFI>=0.8 and <=.89. Bentler (1990, cited by Byrne, 2006) revised the NFI to consider sample size and proposed the Comparative Fit Index (CFI). Values for both the NFI and CFI range from zero to 1.00 and are derived from comparison between the hypothesized and independence models, as described previously. As such, each provides a measure of complete covariation in the data. Although a value > .90 was originally considered representative of a well-fitting model (see Bentler, 1992, cited by Byrne, 2006), a revised cutoff value close to 0.95 has been advised (Hu & Bentler, 1999, cited by Byrne, 2006). Although both indexes of fit are reported in the EQS output, Bentler (1990, cited by Byrne,2006) suggested that the CFI should be the index of choice | ||
| Non-Normed Fit Index (NNFI) | NNFI>=0.8 and <=.89. It is a variant of the NFI that takes model complexity into account. Values for the NNFI can exceed those reported for the NFI and can also fall outside the zero to 1.00 range.(Byrne, 2006) | ||
| Root Mean Square Error of Approximation (RMSEA) | RMSEA>=0.05 and <=0.08 / The RMSEA considers the error of approximation in the population and asks the question, “How well would the model, with unknown but optimally chosen parameter values, fit the population covariance matrix if it were available?” (Browne & Cudeck, 1993, pp. 137-8, cited by Byrne, 2006). This discrepancy, as measured by the RMSEA, is expressed per degree of freedom, thus making it sensitive to the number of estimated parameters in the model (i.e., the complexity of the model). Values less than .05 indicate good fit, and values as high as .08 represent reasonable errors of approximation in the population (Browne & Cudeck, 1993, cited by Byrne, 2006). Addressing Steiger’s (1990, cited by Byrne, 2006) call for the use of confidence intervals to assess the precision of RMSEA estimates, EQS reports a 90% interval around the RMSEA value. In contrast to point estimates of model fit (which do not reflect the imprecision of the estimate), confidence intervals can yield this information, thereby providing the researcher with more assistance in the evaluation of model fit. | Hair et al, (2014); Byrne, (2006); Chau, (1997); Heck, (1998) | |
| Convergent Validity (CV) | All items of the related factors are significant (p < 0.01), the size of all standardized factorial loads are exceeding 0.60 (Bagozzi & Yi, 1988) the extent to which different assessment methods concur in their measurement of the same trait (i.e., construct)-ideally, these values should be moderately high (Byrne, 2006) | Bagozzi & Yi, (1988); Byrne, (2006) | |
| Variance Extracted Index (VEI) | VEI > 0.50 / In all paired factors as constructs. In a matrix representation, The diagonal represents the (VEI), while above the diagonal part presents the variance (the correlation squared); below the diagonal, is an estimate of the correlation of factors with a confidence interval of 95%. See the Table. Discriminant validity of the theoretical model mentioned below. | Fornell & Larcker, (1981) | |
| Discriminant Validity (DV) | DV / It is the extent to which independent assessment methods diverge in their measurement of different traits-ideally, these values should demonstrate minimal convergence.(Byrne, 2006). DV is provided in two forms: First, with a 95% interval of reliability, none of the individual elements of the latent factors correlation matrix contains 1.0 (Anderson&Gerbing,1988). Second, VEI between the each pair of factors is higher than its corresponding VEI (Fornell & Larcker,1981). Therefore, based on these criteria, different measurements made on the scale show enough evidence of reliability, CV and DV. See the Table. Discriminant validity of the theoretical model mentioned below. | Byrne, 2006; Anderson & Gerbing,(1988); Fornell & Larcker,(1981) | |
| Nomological Validity (NV) | It is tested using the chi square, through which the theoretical model was compared with the adjusted model. The results indicate that no significant differences are good theoretical model in explaining the observed relationships between latent constructs | Anderson & Gerbing,(1988); Hatcher, (1994) | |
Author: Several authors, by own adaption.
About the reliability and validity of the measurement scales, it was used the Confirmatory Factor Analysis (CFA) by mean of the maximum likelihood method with EQS 6.1 software (Bentler 2006; Brown, 2006; Byrne, 2006). Cronbach's alpha and the Composite Reliability Index (CRI) (Bagozzi & Yi, 1988) were used as a techniques to prove the reliability of the measurement scales where all the values exceeded the recommended value of 0.7 for both measurements, which indicates that there is evidence and justifies internal reliability of the scales (Hair et al., 2014). It represents the variance extracted from the group of the observed variables and the fundamental construct (Fornell & Larcker, 1981), particularly, values 0.6 are desirable (Bagozzi & Yi, 1988).The settings used in this study were: the Normed Fit Index (NFI), the Non-Normed Fit Index (NNFI), the Comparative Fit Index (CFI) and the Root Mean Square Error of Approximation (RMSEA) (Bentler & Bonnet, 1980; Byrne, 2006; Bentler, 1990; Hair et al. 2014; Chau 1997; Heck, 1998). Values of NFI, NNFI and CFI between 0.80 >= and <= 0.89 represent a reasonable fit (Hair, et al.,2014) and >= 0.90 represents an evidence of a good fit of the theoretical model (Byrne, 2006). RMSEA < 0.08 are acceptable (Hair et al., 2014). The CFA results are presented in Table 7.
Table 7 Internal Consistence and Convergent Validity Evidence of the Theoretical Model
| Factor | Item | Variable | Factor Loading>0.6 (a) | Robust t-Value | Average Factor Loading | Cronbach’s Alpha>=0.7 (b) | CRI (b) | AVE>0.5 (c) |
|---|---|---|---|---|---|---|---|---|
| STR | 1 | SOBM | 0.701*** | 1.000a | 0.713 | 0.718 | 0.719 | 0.670 |
| 2 | SIPR | 0.824*** | 57.666 | |||||
| 3 | PSTR | 0.616*** | 9.651 | |||||
| TEC | 4 | TECM | 0.680*** | 1.000a | 0.702 | 0.710 | 0.718 | 0.689 |
| 5 | TECP | 0.733*** | 27.854 | |||||
| 6 | PTEC | 0.695*** | 17.941 | |||||
| BMG | 7 | MKS | 0.823*** | 1.000a | 0.706 | 0.711 | 0.727 | 0.678 |
| 8 | VPR | 0.950*** | 68.010 | |||||
| 9 | CRM | 0.680*** | 27.739 | |||||
| 10 | PTF | 0.703*** | 21.236 | |||||
| 11 | RIPR | 0.603*** | 7.078 | |||||
| 12 | KYR | 0.634*** | 7.120 | |||||
| 13 | KYA | 0.610*** | 7.051 | |||||
| 14 | CST | 0.715*** | 49.401 | |||||
| 15 | PTS | 0.741*** | 56.501 | |||||
| 16 | POBM | 0.604*** | 7.041 | |||||
| NWE | 17 | IPR | 0.694*** | 1.000a | 0.708 | 0.712 | 0.719 | 0.601 |
| 18 | DIV | 0.730*** | 6.959 | |||||
| 19 | POBM | 0.700*** | 6.361 | |||||
| OIO | 20 | ORBM | 0.803*** | 1.000a | 0.719 | 0.721 | 0.725 | 0.645 |
| 21 | GOV | 0.692*** | 18.467 | |||||
| 22 | POIO | 0.664*** | 9.327 | |||||
| Results: (S-BX² with df= 205) = 135.604; df=155; p < 0.000; NFI = 0.802; NNFI = 0.813; CFI = 0.818; RMSEA = 0.064. Conclusion: the relationships among the variables and dimensions, have good adjustment and a good fit to the data; hence, exist enough evidence of convergent validity and reliability, which justifies the internal reliability of the scales (Nunnally & Bernstein, 1994; Hair et al., 2014) | ||||||||
Notes: *** Parameters constrained to the value in the identification process = p < 0.01
a. According Bagozzi & Yi, 1988.
b.- According Hair 2014.
c.- Average Variance Extracted (AVE), according Fornell & Larcker, 1981.
Source: Own.
Additionally, Cronbach's alpha and the CRI exceed the value of 0.70 recommended by Hair (2014) and the Average Variance Extracted (AVE) was calculated for each pair of constructs, resulting in an AVE more than 0.50 (Fornell & Larcker, 1981). As evidence of convergent validity, the results pointed out that all of the CFA items factor related are significant (p <0.001) and the magnitude of all the factorial charges is superior of 0.60 (Bagozzi & Yi, 1988).
Likewise, all the items of related factors are significant (p < 0.001). The size of all the standardized factorial loads are above the value 0.60 (Bagozzi & Yi, 1988).
These values indicate that there is enough evidence of convergent validity and reliability, which justifies the internal reliability of the scales (Nunnally & Bernstein, 1994; Hair et al., 2014). Regarding the discriminating validity of the theoretical model, the evidence is shown in Table 8.
Table 8 Discriminant Validity Measuring of the Theoretical Model
| Factor | STR | TEC | BMG | NWE | OIO |
|---|---|---|---|---|---|
| STR | 0.670 | 0.088 | 0.066 | 0.067 | 0.030 |
| TEC | 0.450-0.736 | 0.689 | 0.071 | 0.054 | 0.051 |
| BMG | 0.779-0.965 | 0.415-0.620 | 0.678 | 0.087 | 0.061 |
| NEW | 0.677-0.702 | 0.814-0.905 | 0.421-0.599 | 0.601 | 0.043 |
| OIO | 0.667-0.805 | 0.704-0.866 | 0.705-0.815 | 0.698-0.801 | 0.645 |
Note: The diagonal represents the Average Variance Extracted (AVE), whereas above the diagonal part presents the Variance (the correlation squared). Below the diagonal, it is shown the correlation estimation of the factors with a confidence interval of 95%.
Source: Own.
-It can be seen the confidence interval test (Anderson & Gerbing, 1988), which establishes that, with an interval of 95% of reliability, none of the individual elements of the latent factors of the correlation matrix has the value of 1.0.
-It can be seen the extracted variance test (Fornell & Larcker, 1981) which indicates that the variance extracted between each pair of constructs is higher than their corresponding AVE. Therefore, according to the results obtained from both tests, it can be concluded that both measurements show enough evidence of discriminating validity from the theoretical model.
5. Results
In order to prove the hypotheses presented in the theoretical model, a structural equations modeling (SEM) with software EQS 6.1 by means of CFA of first order was applied (Bentler, 2006; Byrne, 2006; Brown, 2006). So, the nomological validity of the theoretical model was examined through the Chi-square test, which compared the results obtained between the theoretical model and the measurement model. Such results indicate that the differences between both models are not significant which can offer an explanation of the relationships observed among the latent constructs (Anderson & Gerbing, 1988; Hatcher, 1994). See Table 9.
Table 9 Structural equation modeling results from the theoretical model
| Hypotheses | Path | Standardized path coefficients | Robust t-Value |
|---|---|---|---|
| H1. Higher level of STR higher level of OBM at ITSZMG; . The model has significant positive effect. | STR→OBM | 0.789*** | 24.429 |
| H2. Higher level of TEC higher level of OBM at ITSZMG; . The model has significant positive effect. | TEC→OBM | 0.866*** | 33.887 |
| H3. Higher level of BMG higher level of OBM at ITSZMG; . The model has significant positive effect. | BMG→OBM | 0.750*** | 56.457 |
| H4. Higher level of NWE higher level of OBM at ITSZMG; . The model has significant positive effect. | NWE→OBM | 0.733*** | 34.876 |
| H5. Higher level of OIO higher level of OBM at ITSZMG; . The model has significant positive effect. | OIO→OBM | 0.876*** | 45.987 |
| Results: (S-BX² with df = 270) = 81.201; p < 0.000; NFI = 0.820; NNFI = 0.844; CFI = 0.823; RMSEA = 0.060. | |||
| Note: *** = p < 0.01 | |||
| Conclusion: The model has significant positive effect among the Factors | |||
Source: Own.
6. Discussion
We emphasize the value of this study because is the result of an extensive literature review to obtain the main OBM variables contrasted with the experience of the specialists at ITSMZG, through AHP and Delphi’s Panel. It is quite clear at the ITSMZG, that the concepts have not been enough disseminated, understood and applied in the field of the OBM. This represents a great chance for the ITSMZG, because is necessary the actions planning and execution to increase the rest of 18 variables (see Table 7, factor loading values >=0.6 and <=0.8) in order to improve the conceptual OBM. According the results of our empirical OBM model, we recommend for the ITSMZS, the next actions:
-For strategy (STR) factor, is necessary that the firm in strategy OBM (SOBM) variable, firstly defines with accurate the kind of design to use, for instance: efficiency-centric open business model; user-centric open business model; crowd-based innovation strategies; collaborative open business model; open platform business model or other; this is because each different design brings different actions plans, saving time and resources. For strategy on intellectual property rights (SIPR), although there is a level of awareness about this, is not reflected in real actions to create, generate and protect the IPR. For the firm, is highly recommended, defines the main motivation for registration and how to make business with IPR.
-For technology (TEC) factor, we have that one main feature of OBM is to see for internal and external resources and capabilities to create, share, buy and/or sell technology. In this sense for technology based on market (TEM) will require some kind of technology based on policies (TECP), onto the firm to chek out the opportunities and make it happen.
-For open business management OBM factor, as we’ve seen, we believe that the Osterwalder & Pigneur (2010) model is enough to adapt it and apply it with its most important variable blocks: MKS.Market segmentation; CRM.Customer relationship management; PTF.Platform-Channels; VPR.Value proposition ; RIPR.Revenues per IPR ; KYR.Key resources;; KYA.Key activities; PTS.Partenrship; CST.Cost structure. Some of these elements would be more por less strategic according the level of relationships with resources and capabilities of third parties (partners) as a main feature of the OBM process.
-For new entrepeneurshps (NWE) factor, also we found out a low level of awareness to use it, but it reperesents the main product of the OBM and here, it has been divided in: intellectual property rghts (IPR) pretty relationated with strategy intellectual property rights (SIPR) and the lean start-up (LST), as the best indicator of how the OBM is able to create new enterprises by mean of spin-offs, start-ups, etc.
-For open innovation orientation (OIO) factor through the orientation business management (ORBM) we determine the factor where the firm decides the mode of OBM is going to be applied it´s the heart of the planning block and involves the connection of how the knowledge is going to be used for the development and how is going to be integrated in the OBM. To make it happen, is necessary regulations involved in form of governance to control all the process.
-Also, it’s highly recommended the design of several key performance indicators for each one of the factors such as performance of: strategy (PSTR), technology (PTEC), business model management (PBMG), new entrepeneurships (PNWE) and finally, open innovation orientation (OIO) to measure and feedback all the process and take the better decisions for improvement of each factor.
-Finally, for further studies of this empirical OBM is important to determine also, the most important indicators in the model, suggesting a linear regression analysis to find out the correlations between the factors and variables and analyze, how they are interacting in the model.
-For most generalized model, we suggest to replicate this empirical OBM in other similar industry of the area, just like: the biopharmaceutical sector or the automobile sector to establish a general empirical model for OBM.
7. Conclusion
This study concluded answering all the specific questions (SQ1, SQ2, SQ3) and the general question (GQ), with a proposition of a conceptual OBM framework (see Appendix 1), with 5 factors: STR (3 variables/14 indicators), TEC (3 variables/24 indicators), BMG (10 variables/76 indicators), NWE (3 variables /7indicators) and OIO (3 variables/18 indicators) (See Scheme 1). Lmodel has significant positive effect in our pose hypotheses, mainly in 4/24 variables (see Table 7 factor loading values >=0.8): SIPR, MKS, VPR and ORBM. This proposition is product for the academic vision (literature review) and the consulting of specialists experience at ITSMZG, through the analytic hierarchy process (AHP).

