1. Introduction
In recent years, patch antennas have had a great evolution, mainly for specific applications in biomedicine1,2,3. The versatility to configure them, the ease to implement different geometric designs that allow to obtain configurations at operating frequencies and punctual bandwidths, make it an excellent option to continue in the characterization of signals that respond to wavelengths friendly to the human body, for animals, in nature and in some little explored ecosystems4,5. According to 1 and 2 for the Medical Implant Communications Service (MICS) communications are carried out in bands ranging from 402 MHz to 405 MHz. On the other hand, in the industrial, medical, and scientific sectors, communications range from 2.4 GHz to 2.48 GHz3.
Two strategies to optimize these resonator devices are the application of cuts in the corners of the geometry and the realization of perforations or slots6,7,8, which are simple to implement by parameterization or geometric ratios that allow to improve the gain (G), the operation frequency (f c or f r ), Standing Wave Ratio (VSWR), Reflection Coefficient (S11), efficiency and radiation patterns9,10, so that they can resonate at the given operating frequency, as well as within the reference relative permittivity and conductivity parameters for specific biomedical applications1,2,3.
With the support of numerical methods and CAD software, accurate approximations can be obtained for implementation in the laboratory and in specific applications, so it is important to carry out a simulation to understand the functionality of the device. In this work, Ansys Electronics student version is used, which allows to calculate the fundamental parameters and to have a broad overview of the antenna operation.
The structure of this article is as follows: In Section 1, a brief introduction is presented. Section 2 shows the antenna design and substrate details, where the design equations, substrate characteristics, as well as the evolution of the designs are shown. In section 3, the evolution of the designs is presented. Simulation and results, as well as a performance comparison with other 2.4 to 2.5 GHz resonant frequency antennas reported in the literature, with FR-4 as substrate, are shown in section 4. Finally, in section 5, some concluding remarks, and future work are given.
2. Antenna design
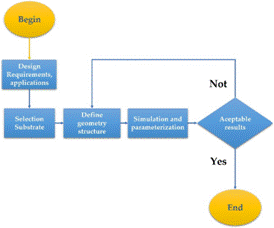
The steps followed in this research work are summarized in the flowchart shown in Fig. 1, which starts from the conception of the idea, continues with the design of the antenna, from the fundamental equations, the modifications in the geometry as part of the optimization and the simulation of the substrate requirements, until the desired results are obtained.
It starts with a conventional rectangular microstrip-fed rectangular antenna configured at 2.4 GHz, with FR-4 as substrate. Eqs. (1) to (12)6,7,8,9,10,11,12,13 were used to design the antenna:
To calculate the effective dielectric constant:
The increment in length (ΔL) or extent to calculate the patch length (L p ), is calculated as follows:
For the calculation of the patch length, it is necessary to obtain the effective length:
Finally, to calculate the patch width:
Eq. (5) allows the calculation of the resonant frequency or center frequency of the antenna:
The calculation of the dimensions of the ground plane or substrate is performed as follows: to calculate the length, the following geometric relationship was considered:
For the calculation of the substrate width, Eq. (7) is used:
where C 0 : Free space velocity of light, f r : Resonant frequency for the current design, ε r : Dielectric constant of the substrate, h: Thickness of the substrate, and ƞ: Efficiency.
The next step will be to calculate the dimensions of the microstrip (W 3 and L 3 ), as shown in Fig. 2b, by using Eqs. (8) and (9)11:
Eqs. (10) and (11) are used to calculate the dimensions, length, and width of the microstrip (L3 and W3) or transmission line, where the antenna feed will be coupled, as follows:
To calculate W3, Eq. (12) is used, with the coupling impedance data, in this case Z0=50 Ω.
With the above equations, the dimensions of the resonator patch located at the top of the substrate, the ground plane located at the bottom of the substrate and the dimensions of the microstrip are obtained, as shown in Fig. 2.
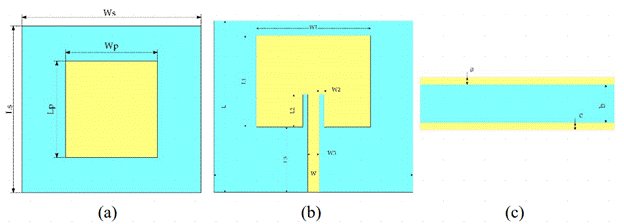
Figure 2: (a) Dimensions of the patch and substrate, (b) antenna dimensions with microstrip (initial design, with Ls=L, Ws=W, Lp=L1, and Wp=W1), c) cross-sectional view of the substrate.
The parameters used to carry out the antenna simulation are shown in Table 1. It was used FR-4 Epoxy13,14.
Table 1: Properties of FR-4.
| Parameters and units | Value |
|---|---|
| Relative permittivity (εr) | 4.4 |
| Relative permeability | 1 |
| Dielectric Loss Tangent | 0.02 |
| Mass density | 1900 |
| Impedance port1, Z0 (Ω) | 50 |
Table 2 shows the dimensions of the patch antenna, the ground plane, and the dimensions of the microstrip, which were obtained with the equations described above.
Table 2 Dimensions of preliminary antenna.
| Parameters | Values (mm) |
|---|---|
| Substrate length (L s ) | 60 |
| Substrate width (W s ) | 60 |
| Substrate thickness (h=b) | 1.60 |
| Patch length (L p = L 1 ) | 29.4 |
| Patch width (W p =W 1 ) | 38 |
| Slot length (L 2 ) | 9.5 |
| Slot width (W 2 ) | 1 |
| Microstrip width (W 3 ) | 3 |
| Microstrip length (L 3 ) | 15.3 |
3. Design sequency
3.1. Implementation of slots
The evolution of the microstrip coupled antenna is given in Fig. 2b, applying a pair of internal cuts, with dimensions calculated by Eq. (10) for L 2 and W 2 , these cuts emulate the slots used in optics to generate constructive and destructive waves, it is implemented to observe the effect on the operating parameters of the antenna. The arrangement and location of these slots can be seen in Fig. 3.
For each slot implemented to the antenna in Fig. 3, an identifier was assigned to it, to compare the generated parameters, as shown in Table 3.
Table 3 Simulation results of antenna with slots.
| Antenna | Freq (GHz) | S11 (dB) | Gain total (dB) | Bandwidth (MHz) | VSWR <2 | Efficiency (ɳ) |
|---|---|---|---|---|---|---|
| Initial Design | 2.22 | -22.81 | 2.22 | 118.8 | 1.25 | 0.085 |
| Slots 1 | 2.23 | -24.49 | 2.14 | 56.3 | 1.03 | 0.44 |
| Slots 2 | 2.20 | -20.85 | 1.55 | 55.5 | 1.57 | 0.38 |
| Slots 3 | 2.18 | -21.27 | 1.71 | 57.3 | 1.5 | 0.43 |
| Slots 4 | 2.19 | -24.77 | 1.58 | 54.8 | 1 | 0.41 |
The responses shown by the four designs allow selecting only one of these, since the combination of two or more slots in the antenna impacts negatively decreasing the gain, the efficiency and the center frequency is moving away from the target (2.4 GHz). Therefore, the antenna slots 1 is chosen to continue with the next step.
3.2. Implementation of antenna corner cuts
On the design, slots 1, some geometrical optimizations will be developed, starting with four cuts at the corners of the patch applying the following geometrical relations described in Figs. 3a and 3b:
Length of the corner cuts:
2.5 mm:
3 mm:
3.5 mm:
4.5 mm:
5 mm:
5.45 mm:
5.5 mm:
5.6 mm
5.75 mm
6 mm
6.5 mm
The slots separation was obtained from:
These are equations for the geometrical relationships of the corner cuts and provided the best response within the center frequencies of the 2.4 GHz antenna. Fig. 4 shows the dimensions for the corresponding corner cuts and slots.
Geometric optimization was applied to the corners of the antenna by applying cuts from 2.5 mm to 6.5 mm as shown in Eqs. (13) to (24). These cuts generated the resonant frequency behaviors with respect to the reflection coefficient S11, the standing wave ratio VSWR and gain, shown in Fig. 5.
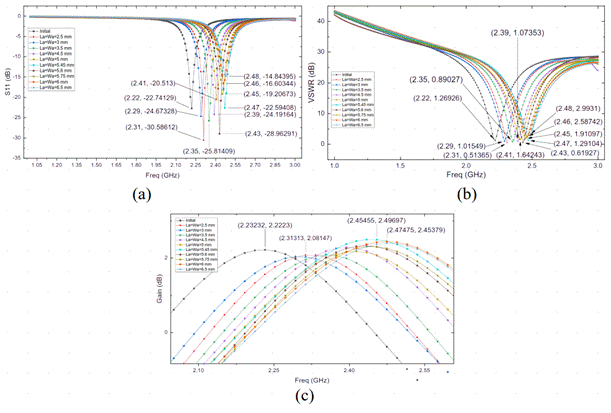
Figure 5: Behavior of (a) frequency vs S11, (b) frequency vs VSWR and (c) frequency vs Gain of all the corner cuts performed on the antenna.
Based on the graphical behavior of the antenna parameters, Table 4 is generated, where the results generated by the corner cuts are summarized. The corner cuts were performed symmetrically so that the length and width were varied in the same conditions and dimensions.
From Table 4, it is observed that the device with the corner cut at 5.6 mm has the best VSWR response (0.61), this is an acceptable value result in accordance with7. In addition, it has an operating frequency of 2.43 GHz with S11=-28.96 dB, values adequate for biomedical applications13,14.
Table 4: Antenna results when corner cuts were applied.
| Design or corner cots length (mm) | f c =f r (GHz) | S11 (dB) | VSWR <2 | Gain (dB) | BW (MHz) | ɳ |
|---|---|---|---|---|---|---|
| Fig. 2b | 2.22 | -22.81 | 1.25 | 2.22 | 60.5 | 0.45 and 0.085 in 2.4 GHz |
| Fig. 3a | 2.23 | -24.49 | 1.03 | 2.14 | 56.3 | 0.44 and 0.0748 in 2.4 GHz |
| 2.5 | 2.31 | -30.58 | 0.51 | 2.08 | 60.7 | 0.43 and 0.18 in 2.4 GHz |
| 3 | 2.29 | -24.67 | 1.01 | 2.03 | 64.6 | 0.35 and 0.2798 in 2.4 GHz |
| 3.5 | 2.35 | -25.81 | 0.89 | 2.08 | 60.2 | 0.42 and 0.27 in 2.4 GHz |
| 4.5 | 2.39 | -24.19 | 1.07 | 2.28 | 62.2 | 0.447 and 0.444 in 2.4 GHz |
| 5 | 2.41 | -20.51 | 1.64 | 2.18 | 67.5 | 0.44 |
| 5.45 | 2.47 | -22.59 | 1.29 | 2.49 | 69.8 | 0.46 |
| 5.6 | 2.43 | -28.96 | 0.61 | 2.33 | 66 | 0.44 |
| 5.75 | 2.45 | -19.20 | 1.91 | 2.3 | 66.9 | 0.44 |
| 6 | 2.46 | -16.60 | 2.58 | 2.39 | 69 | 0.43 |
| 6.5 | 2.48 | -15.35 | 2.99 | 2.39 | 63.2 | 0.42 |
3.3. Implementation of a top notch
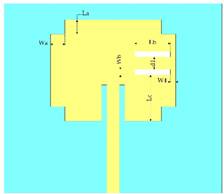
The design of the antenna with the corner cuts of 5.6 mm was chosen to continue optimizing the antenna. Now, a symmetrical notch will be made on the edge or top side of the patch with respect to the microstrip, see Fig. 6.
Initially, the notch is applied with the following dimensions W b =1 mm and L b =L 2 =9.5 mm. Subsequently, the optimization will be performed by increasing W b by 1, 3, 5, 5, 6 and 6.5 mm, since these are the dimensions that generated results within the resonance frequency. The parameterization is performed without moving to L 2 =9.5 mm, as shown in Table 5.
This result allows selecting the notch width W b =6 mm, since the gain is higher with respect to the design without top notch in Table 4. In addition, the VSWR<2 and S11 is still in acceptable parameter (< -10 dB).
Table 5: Results when applying a different Wb.
| Notch width W b (mm) with L b =9.5 | f c =f r (GHz) | S11 (dB) | VSWR <2 | Gain (dB) | BW (MHz) | ɳ |
|---|---|---|---|---|---|---|
|
|
2.44 | -18 | 2.19 | 2.27 | 63.2 | 0.41 |
|
|
2.45 | -19.9 | 1.76 | 2.43 | 67.3 | 0.44 |
|
|
2.46 | -20.8 | 1.59 | 2.30 | 64.7 | 0.45 |
|
|
2.48 | -20.9 | 1.55 | 2.47 | 64.4 | 0.42 |
|
|
2.49 | -18 | 1.99 | 2.17 | 63.1 | 0.39 |
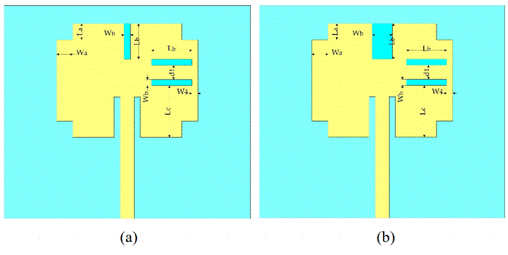
Figure 6: Optimization of the antenna with microstrip applying corner cuts and a top notch (a) initial design, and (b) final design
By selecting to W b =6 mm, the next step in the optimization is to make a dimension variation in the notch now considering its length dimension L b . For this parameterization the first six dimensional variations were placed that generate results within the resonant frequency bandwidth, these results can be observed in Table 6.
The final notch dimensions are L b =6 mm and W b =6 mm, since, as shown in Table 6, it is the one that provides the best response in the antenna operating parameters.
Table 6: Results when applying a top notch on the antenna with different L b .
| Length of notch, with W b =6 (mm) | f c =f r (GHz) | S11 (dB) | VSWR <2 | Gain (dB) | BW (MHz) | ɳ |
|---|---|---|---|---|---|---|
|
|
2.5 | -18.93 | 2 | 2.61 | 67.4 | 0.43 |
|
|
2.49 | -22.12 | 1.36 | 2.58 | 66.6 | 0.43 |
|
|
2.5 | -22.16 | 1.35 | 2.96 | 69 | 0.47 |
|
|
2.49 | -18.36 | 2.1 | 2.56 | 67.2 | 0.43 |
|
|
2.51 | -20.49 | 1.64 | 2.73 | 70.5 | 0.44 |
|
|
2.47 | -18.17 | 2.13 | 2.67 | 66.9 | 0.44 |
4. Simulation results
Table 7 summarizes the results of the last optimized designs with the fundamental operating parameters of the microstrip patch antenna.
Table 7: Results of the antennas that obtained acceptable parameter values.
| ID | Antenna | Freq (GHz) | S11 (dB) | Gain total (dB) | Bandwidth (MHz) | VSWR <2 | ƞ |
|---|---|---|---|---|---|---|---|
| Design 1 | Initial design | 2.22 | -22.81 | 2.22 | 118.8 | 1.25 | 0.085 |
| Design 2 | Slot 1 | 2.23 | -24.49 | 2.14 | 56.3 | 1.03 | 0.44 |
| Design 3 | W a =L a = 5.6 mm | 2.43 | -28.96 | 2.33 | 66 | 0.61 | 0.44 |
| Design 4 |
|
2.48 | -20.9 | 2.47 | 64.4 | 1.55 | 0.42 |
| Final Design |
|
2.5 | -22.16 | 2.96 | 69 | 1.35 | 0.47 |
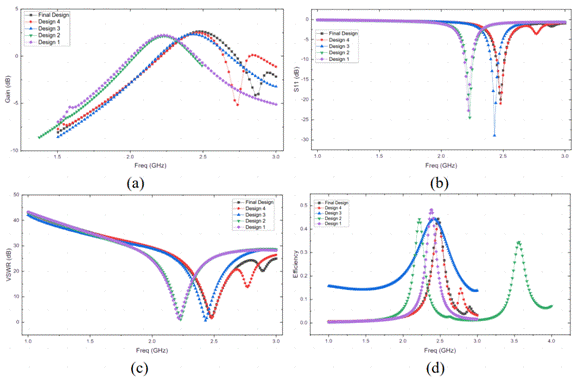
Thus, as can be seen, the evolution of the optimization allows the generation of an antenna for each applied element:
Antenna with 1 mm x 9.5 mm slots (design 2).
Antenna with the slots and 5.6 mm x 5.6 mm corner cuts (design 3).
Antenna with 1 mm x 9.5 mm slot, 5.6 mm x 5.6 mm corner cuts and 6 mm x 9.5 mm top notch (design 4).
Antenna with 1 mm x 9.5 mm slot, 5.6 mm x 5.6 mm corner cuts and top notch of 6 mm x 6 mm (final design, Fig. 6b).
On the other hand, to observe the graphical behaviors of the gain, S11, VSWR and efficiency (ɳ) parameters with respect to a frequency sweep of the five designs shown in Table 7, the operating curves of the five designs from the preliminary antenna to the last optimized design are given, in Fig. 7.
The comparison of the final antenna design with other ones reported in literature is given in Table 8.
Table 8 Comparison of our antenna design with other antennas reported.
| Ref | Freq (GHz) | S11 (dB) | VSWR | Gain (dB) | Bandwidth (MHz) | Size patch (mm) | Total substrate (mm) |
|---|---|---|---|---|---|---|---|
| 10 | 2.41 | -14.10 | 1.49 | 2.65 | 53.6 | 25x25 | FR-4, 50x50x1.6 |
| 11 | 2.40 | -15.28 | --- | 3.05 | --- | 30x37 | FR-4 |
| 12 | 2.40 | -22.21 | --- | 1.6 | 70 | 29x28 | FR-4, 60x66.2x1.6 |
| 13 | 2.40 | -31 | --- | --- | --- | 38.02x28.78 | FR-4, 56x56x1.6 |
| This work | 2.5 | -22.16 | 1.35 | 2.96 | 69 | See Table 2 |
According to the results obtained, we see that our optimized antenna has acceptable response, since it has the most negative values of S11, it is competitive in gain with 11 and in bandwidth with 12. It should be noted that in this work we developed exclusively the geometric or structural parameterization technique, where modifications were applied in dimensions, without connecting or attaching additional elements, such as films or using metamaterials that doped the resonator element, which some authors apply to obtain better responses2,7.
5. Conclusions
It is shown that, from the implementation of slots, the application of corner cuts and the geometrical parameterization for the determination of the notch dimensions, allow to optimize the antenna design. The equations of the geometrical relationships that allowed the parameterization of the dimensions in the antenna corner cuts and top notch are also provided.
The percentage increase in gain with respect to the initial antenna is 34.54%, and the efficiency increased by 552.94%. The optimized antenna has operation frequency at 2.5 GHz. It is known that, due to the manufacturing process and materials used, the center frequency will have a slight shift to the left. Then, in practice, the operation frequency would be located very near to 2.45 GHz, which is the operation frequency considered in Table 9. In case, it would be possible to make the necessary adjustments.
5.1. Future work
The next stage with the optimization shown here and the data of the permittivity and conductivity of the tissues (shown in Table 9) will allow these antennas to be simulated to consider their effects on such tissues.
Table 9 Dielectric properties of human tissues at 2.45 GHz1 2 3.
| Ref | Freq (GHz) | S11 (dB) |
|---|---|---|
| Tissues | Relative permittivity (ε r ) | Conductivity (S/m) |
| Muscle | 52.7 | 1.73 |
| skin | 38 | 1.46 |
| Fat | 5.28 | 0.10 |
| Bone | 18.54 | 0.80 |
Subsequently, fabrication and laboratory tests will be carried out with materials that emulate the tissues, to validate the corresponding responses. To carry out the laboratory tests and emulate these tissues, the data in Table 10 will be used as a reference.


 nueva página del texto (beta)


