Introduction
The Andes Mountains encompass diverse environments along their slopes, ranging from lowland forests to glacier-covered peaks at over 6,000 meters above the sea level (masl). These different environments harbor high levels of species diversity and endemism, and together they make the Andean region one of the most important diversity hotspots on the planet (Myers et al. 2000). The Andean rodent fauna is no exception to these environmental trends. Recent analyses have detected several hotspots of rodent diversity along the Andes, such as the eastern slopes in Ecuador and Peru (Prado et al. 2015; Maestri and Patterson 2016).
The systematics of Neotropical rodents is in a phase of rapid update and improvement, triggered especially by active efforts in Latin American countries to train taxonomic specialists (Voss 2009) and by the recent availability of a synthetic treatment of the entire rodent fauna of South America (Patton et al. 2015). However, many systematic relationships remain to be clarified, especially in clades of Andean rodents such as akodontines and thomasomyines, as well as some oryzomyines and echimyids. Such studies have been difficult to perform due to various limitations in past collecting and inventory work (Patterson 2002), and the logistic difficulties of visiting natural history museums in foreign countries to undertake revisionary work. These difficulties are evidenced, for example, in the data gaps for rodent sampling in various areas, such as in middle elevation forests near Papallacta in eastern Ecuador (Voss 2003).
The rodent fauna of the Andean slopes of northwestern South America is rich in species of Thomasomys. It is not uncommon to find large (e. g., T. aureus), medium (e. g., T. silvestris), small (e. g., T. baeops), and very small (e. g., T. cinnameus) species of the genus living in sympatry (Jarrín 2001; Pacheco 2003, 2015; Lee et al. 2011). Other components of the rodent fauna of the Andean forests include oryzomyines such as Microryzomys, Nephelomys, Oreoryzomys, and the enigmatic Mindomys hammondi, which is known from few specimens (Carleton and Musser 1989; Weksler 2006; Weksler et al. 2006).
The usage of molecular markers has been pivotal to accelerate and improve taxonomic work. One common approach has been the use of DNA barcodes—sequences of the mitochondrial gene COI—which have been applied successfully for facilitating identifications of specimens in Neotropical faunal surveys (Clare et al. 2007; Borisenko et al. 2008); however, this approach has not been used exhaustively with Andean mammals. Here, we use DNA barcoding as evidence to identify and conduct preliminary phylogenetic analysis of rodents from two natural reserves: Otonga, located in the western slopes of the Andes (cis-Andean), and Sangay National Park, located in the eastern slopes of the Andes (trans-Andean). Also, we explore whether populations shared between the eastern and western slopes of the Andes are likely to be conspecific, or alternately whether they represent divergent lineages that may not be recognized under current taxonomic classifications.
Materials and Methods
Sampling. We used selected samples of 21 species of rodents, primarily identified on the basis of morphological characters, collected in two Andean forests: Otonga, a private forest reserve located in the western slopes of the Andes in the province of Cotopaxi in northern Ecuador (Jarrín 2001), and Sangay National Park located in the eastern slopes of the Andes in the provinces of Chimborazo, Morona Santiago and Tungurahua in south-central Ecuador (Armstrong and Macey 1979; Fonseca et al. 2003; Figure 1). Three different field parties collected voucher specimens with tissues during 2006 in Otonga, and during 2010 and 2012 in Sangay. Morphological identifications of all specimens were conducted using specialized taxonomic literature (e. g., Carleton and Musser 1989; Weksler 2006; Patton et al. 2015), and by side-by-side comparisons with voucher specimens from the following collections: Abilene Christian University (ACUNHC) in Abilene, Texas, USA; American Museum of Natural History (AMNH) in New York, New York, USA; Escuela Politécnica Nacional (MEPN) in Quito, Ecuador; Museo Ecuatoriano de Ciencias Naturales (MECN) in Quito, Ecuador; National Museum of Natural History (NMNH) in Washington DC, USA; and Pontificia Universidad Católica del Ecuador (QCAZ) in Quito, Ecuador. Some previous findings of the mammals collected by these parties have been reported elsewhere (Lee et al. 2011; Helgen et al. 2013; Ojala-Barbour et al. 2013; Brito and Ojala-Barbour 2014; Brito et al. 2014; Brito et al. 2017). Examined specimens are housed at different mammal collections as indicated in Appendix 1.
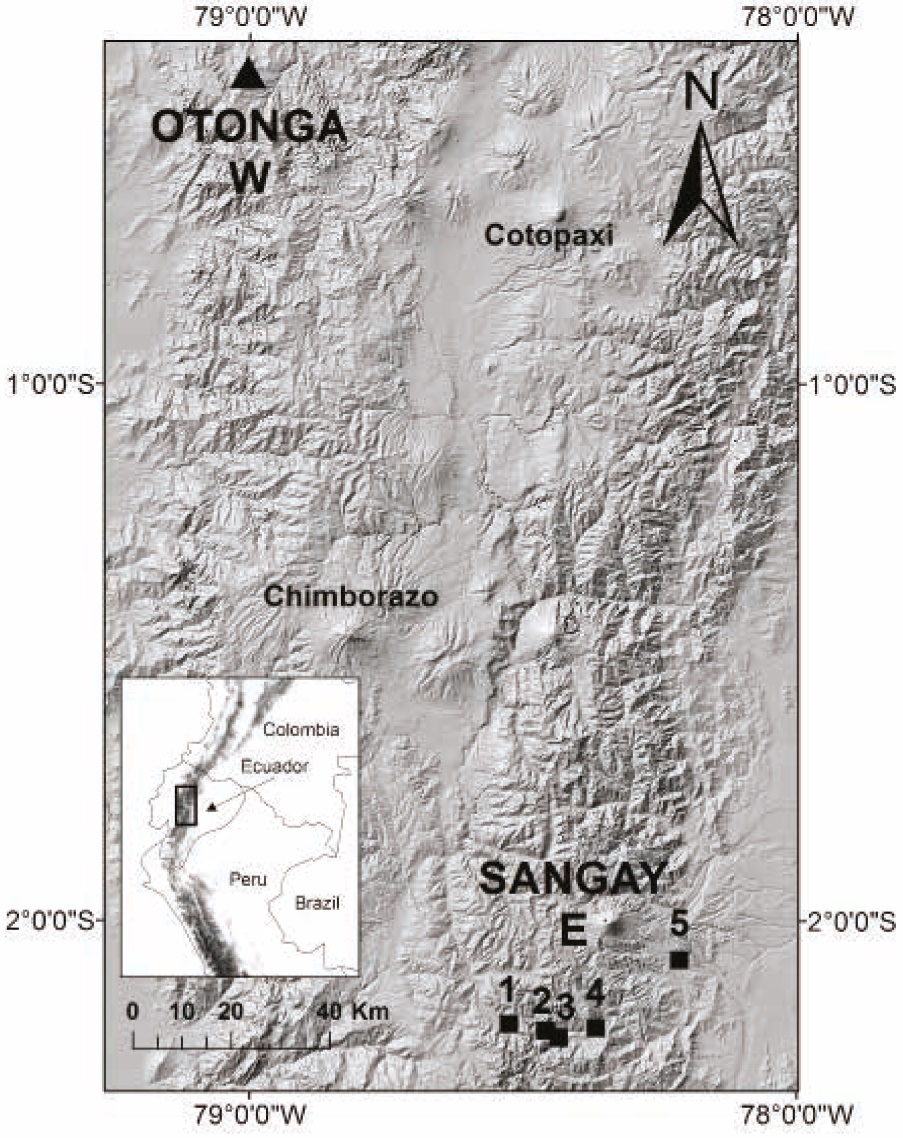
Figure 1 Otonga Reserve and Sangay National Park, localities of the rodent specimens analyzed in this study. Otonga samples were collected by Helgen et al. (2013). For Sangay, points 1 and 2 correspond to localities near the Atillo Lagoon sampled by Lee et al. (2011); and points 3 to 5 correspond to localities sampled by J. Brito and R. Ojala-Barbour (Ojala-Barbour et al. 2013; Brito et al. 2014). Chimborazo and Cotopaxi volcanoes are labeled as points of reference. Inset: map of northwestern South America indicating in a black rectangle the expanded map.
Laboratory work. We used the DNeasy kit (Qiagen, Valencia, California, USA), following the manufacturer´s protocol, to extract DNA of 201 samples of either liver or muscle from rodents collected in Otonga and Sangay. We performed PCR amplifications with the Illustra puReTaq Ready-To-Go PCR beads (GE Healthcare, Little Chalfont, Buckinghamshire, UK) to amplify a fragment of the mitochondrial COI gene using the “cocktail 2”—an M13-tailed primer cocktail optimized for mammals—with the primer ratios and thermal cycle conditions of Clare et al. (2007). We cleaned the PCR products with ExoSAP-IT (Affymetrix Inc., Santa Clara, California, USA), and conducted sequencing reactions with the ABI Big Dye chemistry (Applied Biosystems, Inc., Foster City, California, USA), using the primers M13F and M13R (Messing 1983). We sequenced the products on an ABI 3730xl DNA Analyzer automatic sequencer (Applied Biosystems, Inc., Foster City, California, USA). New sequences were deposited in GenBank (accession numbers: MF806172 – MF806372).
Phylogenetic analyses. We constructed three alignments: (A) an alignment containing our 201 newly generated sequences; (B) an alignment including our sample of Mesomys, a COI sequence of Chinchilla lanigera, and 614 sequences of the COI gene of members of the family Echimyidae (retrieved from the nucleotide database of GenBank searching for “Echimyidae COI”); C) an alignment including our 201 newly generated sequences plus 1,775 sequences of sigmodontinae rodents retrieved from Gen-Bank with the search terms “Sigmodontinae COI”. To align the sequences we used the MUSCLE (Edgar 2004) plugin in Geneious Pro v8.1.5 with default parameters. We checked the alignments manually for obvious misplacements, and trimmed all alignments to a length of 657 bp.
For each alignment we conducted phylogenetic analyses using maximum likelihood in RAxML v8 (Stamatakis 2014). We used the model GTRGAMMA for alignment A— tree A—(Figure 2) and the model GTRCAT for alignments B—tree B—(Figure 3) and C—tree C—(Figures 4 to 7)(5,6). For each analysis support values were estimated using 1,000 nonparametric bootstrap pseudo replicates. For analyses A and C we used as outgroup our sequence of Mesomys, and of Chinchilla lanigera for analysis B. For each RAxML analysis, we started with a complete alignment as described above to obtain the reduced alignment (a matrix without redundant haplotypes); later, we resumed the analysis with the reduced alignment and let it finish.
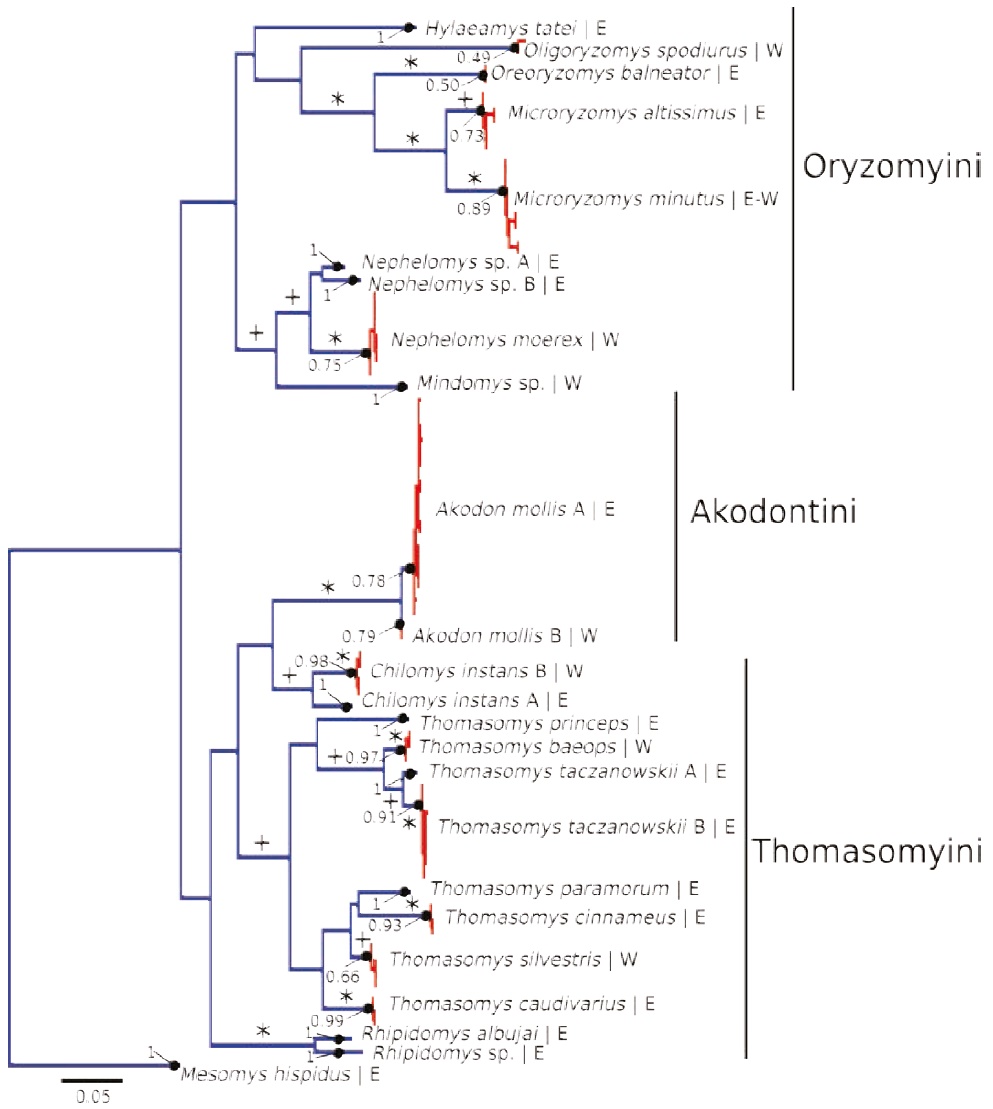
Figure 2 Maximum likelihood gene tree (tree A; see text) of unique haplotypes of the COI gene of the rodents collected in Otonga (West, W) and Sangay (East, E). Color of the branches indicates the results of the PTP species delimitation analysis: monophyletic groups in red indicate a single putative species as well as terminal branches in blue. Numbers associated with each putative species are supporting values of the PTP species delimitation; values of 1 indicate the highest possible support. Single plus symbols indicate main branches with moderate ML bootstrap values ≥75 %, and asterisks indicate main branches with strong ML bootstrap values ≥95 %.
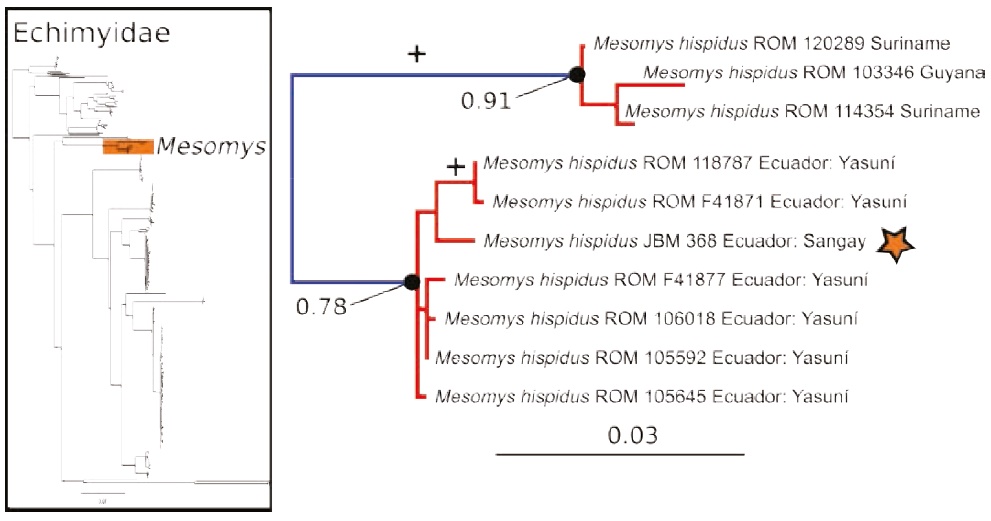
Figure 3 Maximum likelihood gene tree and PTP species delimitation of unique haplotypes of the COI gene of the rodents of the family Echimyidae available in GenBank plus the sample of Mesomys collected at Sangay in the eastern slopes of the Ecuadorian Andes (inset); main figure panel is a zoom-out of tree to depict only the genus Mesomys, showing two putative species within M. hispidus. Colors, symbols and support values correspond to the same as in Figure 2. Names of terminals indicate sample codes and geographic origin of the samples; sequences retrieved from GeneBank keep their original identifications. Star indicates the sample of Mesomys hispidus from Sangay.
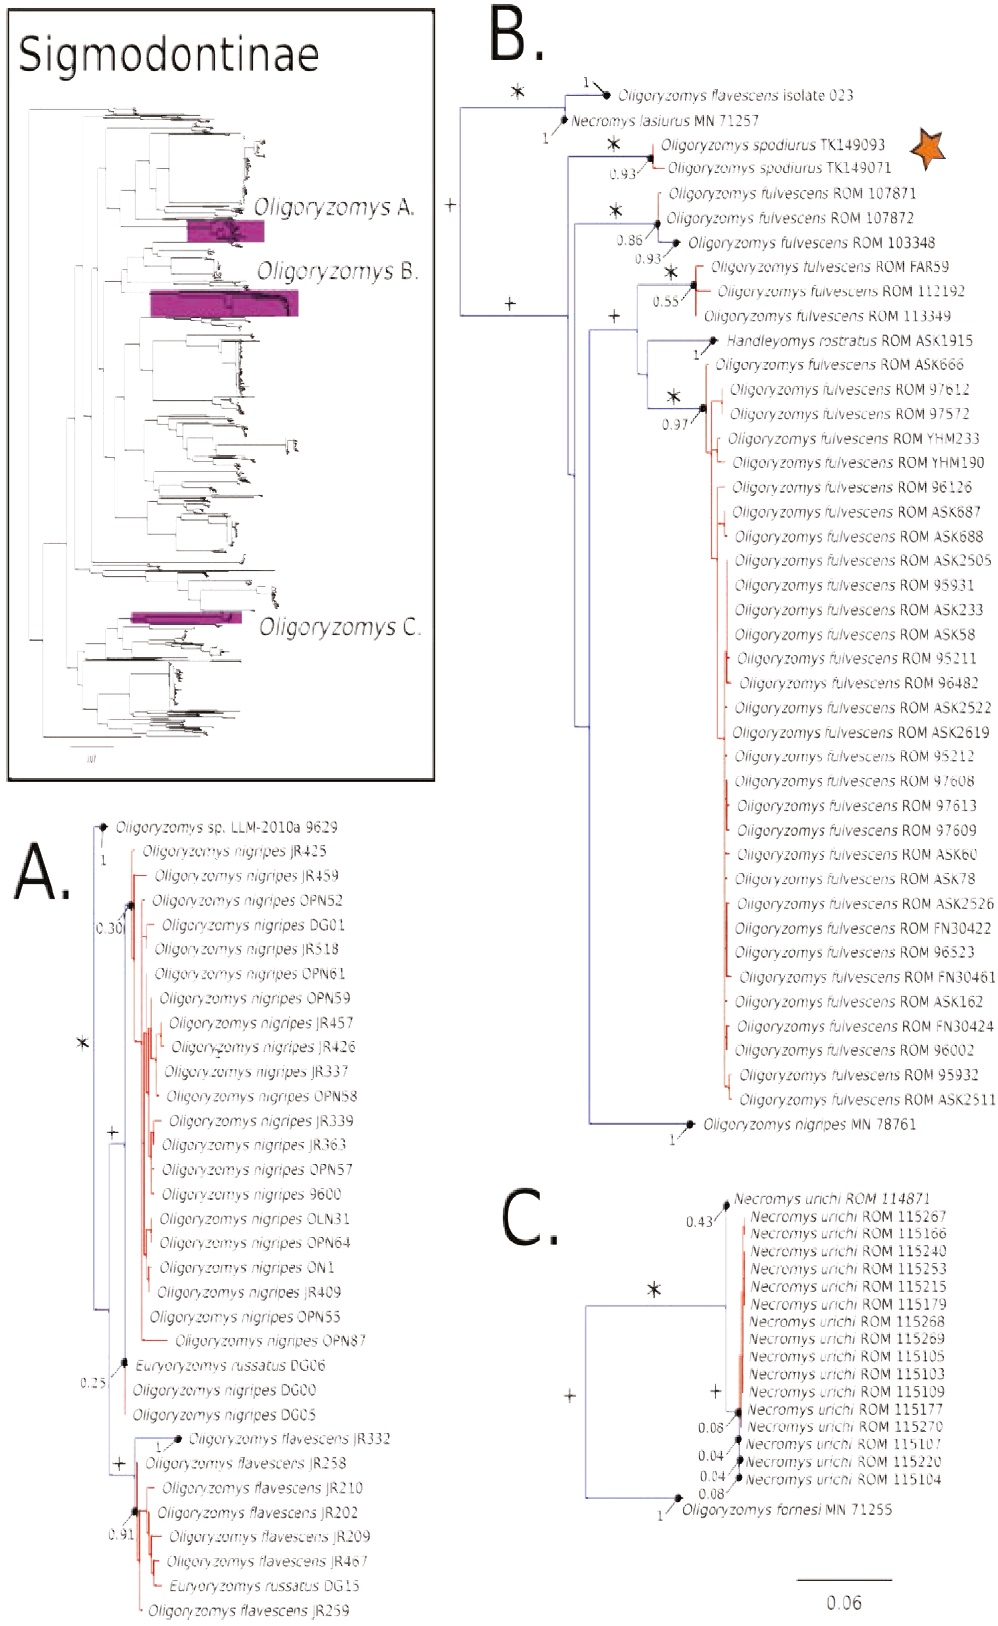
Figure 4 Maximum likelihood gene tree and PTP species delimitation of unique haplotypes of the COI gene of the rodents of the subfamily Sigmodontinae available in GenBank plus our sample (Appendix 1) collected in Otonga Reserve and Sangay National Park (inset). Main figure panels are zoom-outs of the three clades were appear representatives of Oligoryzomys. Colors, symbols and support values correspond to the same as in Figure 2. Names of terminals indicate sample codes; sequences retrieved from GeneBank keep their original identifications. Star indicates the samples of Oligoryzomys spodiurus from Ontonga. Oligoryzomys is depicted as a paraphyletic genus; this is regarded as a spurious result (see text). True Oligoryzomys is depicted in clade B.
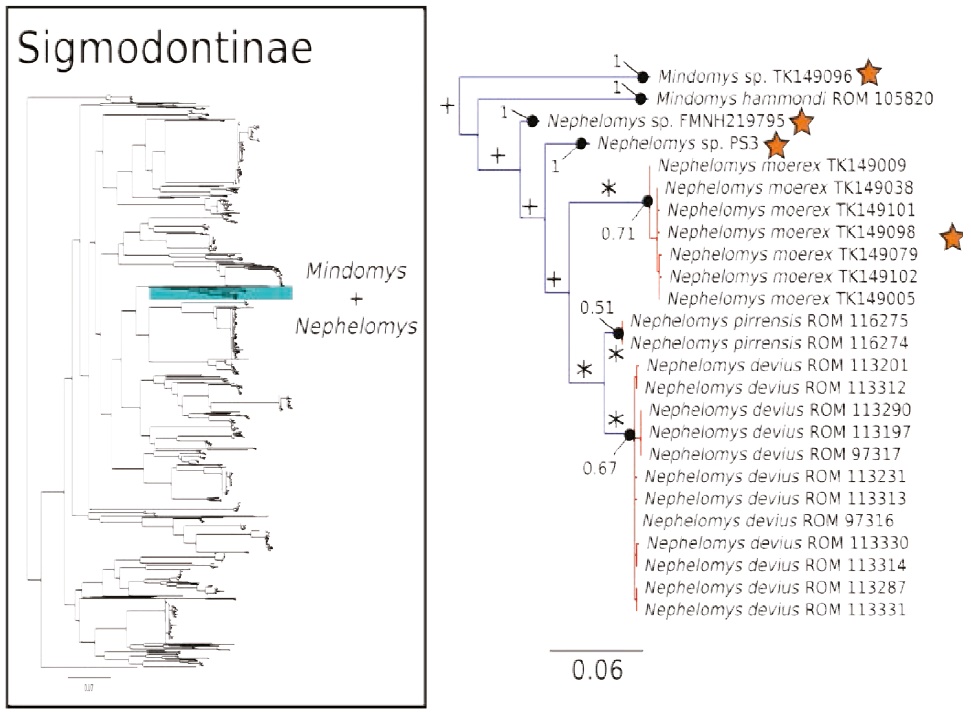
Figure 5 Maximum likelihood gene tree and PTP species delimitation of unique haplotypes of the COI gene of the rodents of the subfamily Sigmodontinae available in GenBank plus our sample (Appendix 1) collected at Otonga Reserve and Sangay National Park (inset). Main figure panel is a zoom-out of the Mindomys + Nepehelomys clade. Colors, symbols and support values correspond to the same as in Figure 2. Names of terminals indicate sample codes; sequences retrieved from GeneBank originally identified as N. albigularis were reclassified as N. devius and N. pirrensis based on their geographic origins. Stars indicate the species of Mindomys and Nephelomys sequenced for this study.
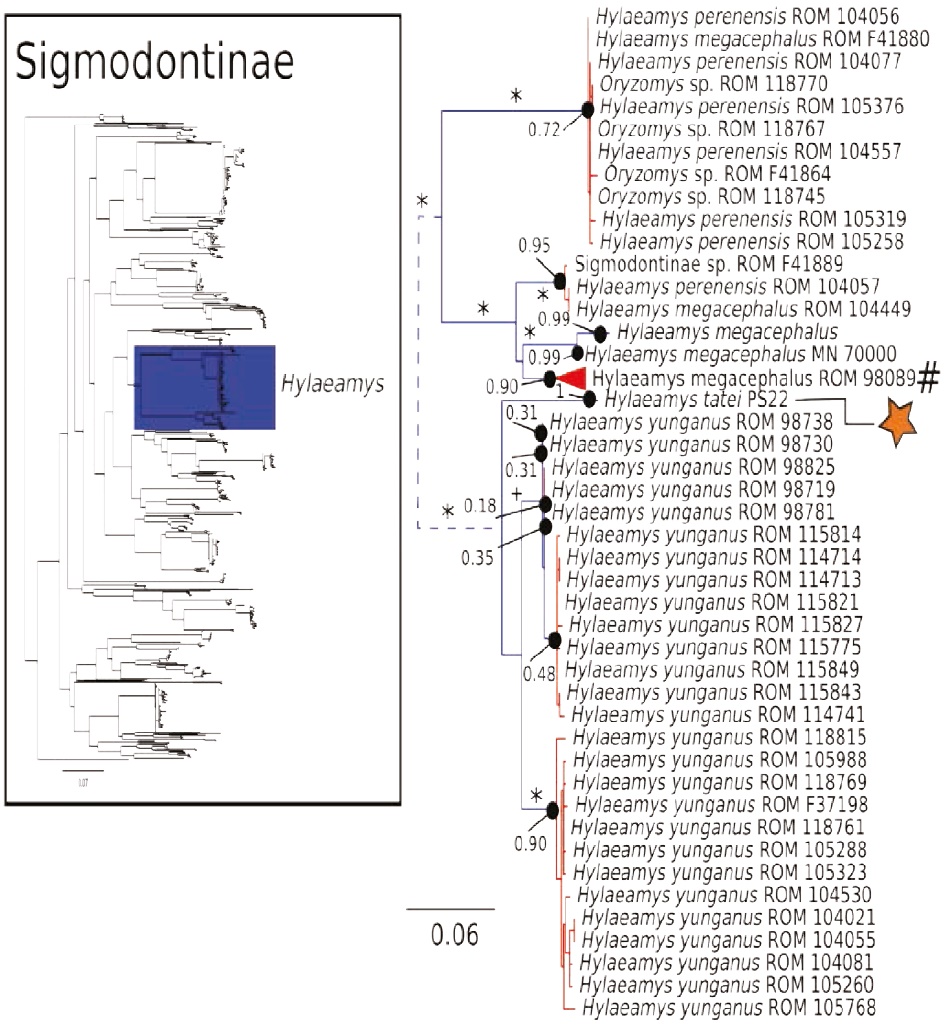
Figure 6 Maximum likelihood gene tree and PTP species delimitation of unique haplotypes of the COI gene of the rodents of the subfamily Sigmodontinae available in GenBank plus all our samples included in Figure 2 collected in Otonga Reserve and Sangay National Park (inset); main figure panel is a zoom-out of the Hylaeamys clade. Colors, symbols and support values correspond to the same as in Figure 2. Names of terminals indicate sample codes; sequences retrieved from GeneBank keep their original identifications. Star indicates the sample of Hylaemays tatei from Sangay. Pound symbol indicates a very large clade of Hylaeamys megacephalus that was collapsed to obtain a clearer representation of this figure. Doted lines indicate branch lengths were reduced.
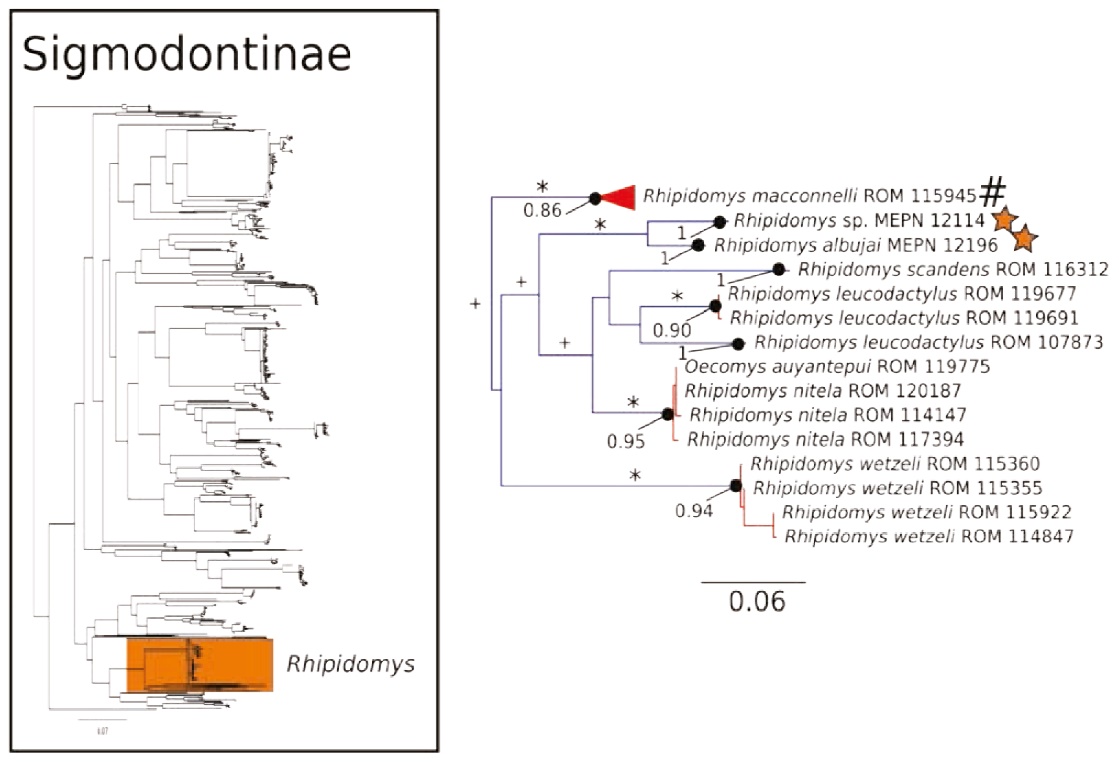
Figure 7 Maximum likelihood gene tree and PTP species delimitation of unique haplotypes of the COI gene of the rodents of the subfamily Sigmodontinae available in GenBank plus all our samples included in Figure 2 collected in Otonga Reserve and Sangay National Park (inset); main figure panel is a zoom-out of the Rhipidomys clade. Colors, symbols and support values correspond to the same as in Figure 2. Names of terminals indicate sample codes; sequences retrieved from GeneBank keep their original identifications. Stars indicate the two species of unnamed Rhipidomys reported in this study. Pound symbol indicates a very large clade of Rhipidomys macconnelli that was collapsed to obtain a clearer representation of this figure.
Species delimitation. We performed species delimitation analyses for the best maximum likelihood trees using the Poisson tree processes (PTP) method in the bPTP web server (Zhang et al. 2013). The PTP method was built as an operational criterion of the Phylogenetic Species Concept (Eldredge and Cracraft 1980). PTP is a fast and accurate species delimitation method that uses as input a non-ultrametric tree; PTP models speciation rates from the number of substitutions in a phylogeny, and expects to find statistically significant differences from intra and inter specific relationships (Zhang et al. 2013). PTP has been successfully applied to mammals and other organism such as trypanosome parasites (Cottontail et al. 2014; Ermakov et al. 2015; Bernal and Pinto 2016), and this method has been found to be more robust than the popular GMYC method that uses time divergences from ultrametric trees which are error prone and computationally expensive to estimate (Zhang et al. 2013; Tang et al. 2014). We ran the PTP analyses for 100,000 MCMC generations for tree A, 200,000 MCMC generations for tree B, and 400,000 generations for tree C. For all analyses we set the thinning value at 100, a burn-in of 0.1, and removed outgroups to improve species delimitation.
Results
Our maximum likelihood gene tree A (Figure 2) recovered a paraphyletic tribe Thomasomyini (represented in our sample by Thomasomys, Chilomys, and Rhipidomys) relative to Akodon mollis; however, the members of the Oryzomyini were recovered as a monophyletic group (Figure 2). The maximum likelihood species delimitation analysis in PTP of tree A returned 24 candidate species. Even though we expected three shared species between both sides of the Andes (Figure 1), the molecular data supported that only one species—Microryzomys minutus—was shared between both eastern and western localities. In contrast, Akodon mollis, and Chilomys instans show structured variation, with percentage of difference >1.4 % between both putative species of Akodon and 7 % between the putative species of Chilomys. Also, our species delimitation suggests that Thomasomys taczanowskii is comprised of two putative species, both distributed in the Eastern slopes of the Andes; the divergence between both is 3 % (Figure 2).
The maximum likelihood gene tree of the family Echimyidae — tree B — (Figure 3) contained 281 unique terminals, and the maximum likelihood PTP analysis of species delimitation returned 42 candidate species. The sample of Mesomys from the eastern slopes of the Andes is nested with sequences of Yasuní National Park from the lowlands of the Ecuadorian Amazonia, confirming that both populations likely correspond to the same species (Figure 3).
The COI gene tree of the subfamily Sigmodontinae (tree C; Figures 4 to 7) (5, 6) consisted of 1,020 unique sequences, and the maximum likelihood species delimitation returned 153 candidate species. The genus Oligoryzomys was recovered as polyphyletic. The Otonga samples of Oligoryzomys destructor are sister to a clade of Oligoryzomys species including 6 candidate species within O. fulvescens and a sample identified as O. nigripes (Figure 4). The genera Mindomys and Nephelomys form a monophyletic group. However, the genus Mindomys (M. hammondi and an undescribed Mindomys from Otonga) was not recovered monophyletic (Figure 5). The specimens of Nephelomys from Sangay National Park might correspond to two different species, with a divergence of 5.6 %, and Nephelomys moerex from Otonga is sister to two Nephelomys species from Central America (Figure 5). The genus Hylaeamys was recovered as monophyletic and H. tatei was nested well inside the genus, as sister to a clade comprised of 6 candidate species currently identified within H. yunganus (Figure 6). Both species of Rhipidomys from Ecuador form a monophyletic group sister to a clade formed by R. scandens, R. leucodactylus (2 putative species), and R. nitela (Figure 7).
Discussion
The DNA barcoding initiative was established as a fast and universal approach to speed the discovery and identification of species (e. g., Hebert et al. 2003; Hebert and Gregory 2005; Harris and Bellino 2013). However, using the mitochondrial COI gene as the marker of choice for mammals has faced resistance from researchers used to working mainly with the CYTB gene; this is shown by the asymmetric number of sequences for the two markers deposited in GenBank (as of December 31st, 2016 there are 37,101 and 136,965 sequences of the mammalian COI and CYTB genes, respectively). Also it has been argued that CYTB gene performs better in deeper nodes of phylogenies, and it seems more informative for discriminating species (Tobe et al. 2010); however, this stance has faced criticism, as it has been demonstrated that COI gene behaves similarly to CYTB gene (Nicolas et al. 2012), and various studies have successfully made use of COI gene for species identifications (e. g., Clare et al. 2007; Borisenko et al. 2008). Although, we are aware that single locus phylogenies are substandard, and well-accepted phylogenetic inferences in mammals are increasingly made with larger, even genomic scale datasets (e. g., Meredith et al. 2011; Foley et al. 2016). In this study we found the COI gene to be a useful marker for species identification; however, more taxa and loci are needed to obtain robust phylogenies of these rodent taxa.
Along the Andes there are three main patterns of allopatric distributions: (1) a latitudinal pattern is evidenced when a pair of sister species are distributed one to the north and the other to the south, e. g., Hippocamelus antisensis (north) vs. H. bisulcus (south), and Nasuella meridensis (north) vs. N. olivacea (south) (Helgen et al. 2009; Pinto et al. 2016); (2) a cross Andean pattern is evidenced when a pair of sister species are distributed with one in the eastern slopes and another in the western slopes of the Andes, e. g., Bassaricyon alleni (east) vs. B. medius (west) (Helgen et al. 2013); and (3) altitudinal pattern is evidenced when one species is in higher elevations and its close relatives are in lower elevations, e. g., Bassaricyon neblina and Dactylomys peruanus vs. the rest of the species in their respective genera (Helgen et al. 2013; Upham et al. 2013). In this work, we highlight further possible examples of the cross Andean pattern of distributions: of the three species supposedly shared between the eastern and western slopes of the Andes, two (Chilomys instans and Akodon mollis) may represent multiple species. However, suggestion of two species within Akodon mollis in particular should be interpreted with caution; the scant genetic differentiation between the Otonga and Sangay specimens (< 2 %) and the fact that A. mollis is a widespread Andean species might suggest that intermediate lineages in the inter-Andean valleys are yet to be found, and we may have only one — not multiple — species level clades (Lee et al. 2011). Further sampling, and the analysis of additional morphological and genetic data will elucidate whether A. mollis is one or multiple species (Alvarado-Serrano et al. 2013). Our results from DNA barcoding provide preliminary views into biodiversity within these lineages which can be explored with other datasets, approaches, and sampling.
As noted, our results indicate that the interpretations of rodent species being widely distributed across both the eastern and western slopes of the tropical Andes should be viewed with certain caution. Of the species that we sampled in our comparisons, only Microryzomys minutus can be considered to indeed occupy both Andean slopes in light of our barcode data. Potentially, this Andean species is well adapted to different environments such as high elevation grasslands (páramos), Andean forests, and inter-Andean valleys. This tolerance to multiple environments would facilitate the colonization of both Andean slopes, but at the same time this may suggest that forest specialists (e. g., Chilomys) would be less likely to colonize both Andean slopes.
Species delimitation methods, such as PTP and GMYC, are useful as an initial approach to delimit species using DNA sequences (Pons et al. 2006; Zhang et al. 2013). While these inferences are useful, there are also several pitfalls associated with these analyses and the results should be taken with caution, particularly when only one method and locus are used (Carstens et al. 2013). In our results, the splitting of Akodon mollis could very well represent a false positive associated with shallow genetic differentiation; however, the deep divergence between both clades within Chilomys instans indicates that the delimitation results might reflect real species-level diversity (Figure 2). In the case of species delimitation of the subfamily Sigmodontinae (Tree C), it is possible that there was an over-splitting of species by the PTP analysis; for example, there was a potential over splitting of Hylaeamys yunganus in multiple species (Figure 6). Further systematic research will clarify the species limits of these taxa.
Following the analyses of González-Ittig et al. (2014) we preliminarily recognize the Oligoryzomys of the western slopes of the Ecuadorian Andes as O. spodiurus; these populations were traditionally regarded as part of the widespread O. destructor (Weksler and Bonvicino 2015). We also recovered Oligoryzomys as paraphyletic, but we propose that this may be due to two artifacts: incorrect identifications of various voucher specimens associated with sequences available in GenBank (sequences of specimen MN71255 [GenBank accession number: KF815407] (Figure 4C) actually belongs to Necromys lasiurus, based on the analysis of CYTB of the same specimen,results not shown); and putative pseudogenes (Numts; Bensasson et al. 2001) in sequences generated by Müller et al. (2013) [GenBank accession numbers: GU938877, GU938878, GU938886-GU938890, GU938892-GU938894, GU938898, GU938899, GU938953, GU938969-GU938988] (Figure 4A), based on the position of these sequences in an analyses of a larger data- set of Oligoryzomys barcodes (M. Weksler et al., in prep.). Traditionally, the genus Oligorzomys has been a hard group to study because of the availability of a large number of taxonomic names and various difficulties inherent in assessing patterns of morphological variation. Fortunately, there have been new efforts to generate a more comprehensive understanding of the diversity in the genus (Weksler and Bonvicino 2005, 2015; González-Ittig et al. 2014; Weksler et al. 2017). Our barcode data corroborate the sister relationship of Oreoryzomys, a poorly studied Andean genus, and Microryzomys (Weksler 2006).
Even though our phylogenetic analysis of the COI gene did not recover the two species of Mindomys as monophyletic (Figure 5), further analysis with the IRBP and CYTB gene do indeed recover these two species as a monophyletic lineage (C. M. Pinto and M. Weksler in prep.), a good example of the marked limitation of DNA barcoding for providing accurate insight into species-level phylogenetics. Mindomys form a monophyletic group with Nephelomys; both of these genera are mostly Andean, with two species of Nephelomys, N. devius and N. pirrensis, distributed in the mountain areas of Central America (Percequillo 2003, 2015). Our barcode data suggest that N. moerex of the western slopes of the Andes may be most closely related to Central American species (Figure 5). Without further systematic study we are not yet confident in assigning species names to the two candidate species of the eastern slopes of the Andes; potential names for these candidate species include N. albigularis, N. auriventer, and N. nimbosus (Brito et al. 2015; Percequillo 2015; Tinoco López 2015).
The tribe Thomasomyini was not recovered as monophyletic in our Maximum Likelihood analyses (Figure 2). This result is not surprising for several reasons: 1) Monophyly of this tribe is not strongly supported in studies using additional molecular data — CYTB and IRBP genes — (Salazar-Bravo et al. 2016). 2) The COI marker is problematic for unveiling deep nodes in phylogenies; a recent example of this limitation is the utility of this marker to in the phylogeny of bats, without using constraints (Amador et al. in press). 3) The taxonomic sampling of the analysis was very limited with only 24 species; it is known that phylogenetic accuracy increases with taxon sampling (Zwickl and Hillis 2002).
Currently, specimens of Thomasomys from Sangay are assigned to T. caudivarius, T. cinnameus, T. paramorum, T. princeps and T. taczanowskii (Lee et al. 2011, 2015). Our phylogenetic analyses show that true T. silvestris, from Otonga, are sister to a clade formed by T. paramorum and T. cinnameus; also the large species T. princeps is closely related to small sized species T. baeops and T. taczanowskii. These relationships differ from previous phylogenetic hypotheses based solely on morphological or CYTB data (Pacheco 2003; Lee et al. 2011, 2015); the single relationship that is constant across phylogenies is the sister relationship of T. baeops and T. taczanowskii. Two putative species were recovered within T. taczanowskii (Figure 2); however, it is possible that they correspond to a single species given the scant genetic divergence with the COI gene (3 %). The puzzling pattern showing that large species of Thomasomys do not form a clade (Lee et al. 2015) potentially indicates multiple origins of the large body-size phenotype, suggesting that the evolution of body size in Thomasomys is more complex than previously suggested by discrete grouping of species by body-size (Pacheco 2003, 2015). Detailed exploration of the radiation of thomasomyine rodents along the Andes is much needed, and will likely provide exciting results about diversification patterns along the Andes, as have emerged from studies of plants (e. g., Monasterio and Sarmiento 1991; Hughes and Eastwood 2006; Nürk et al. 2013).
The results for Echimyidae show that the analyzed sequences of Mesomys hispidus contain two putative species with divergences in the range of 6.9- 7.2 % (Figure 3). One of these putative species is distributed in the Guiana Shield, and the other in the western Amazon of Ecuador. These results are in line with the findings of five relatively deep mitochondrial clades within M. hispidus, with mean divergence 4.6 % (Patton et al. 1994, 2000). Also, our results suggest that the Mesomys sample (JBM 368) from the Andes is conspecific with the Mesomys from Yasuní in the western Amazonian lowlands (genetic divergence ranging from 1.2 to 1.4 %). These results contrast with a previous analysis, in which the sample JBM 368 was assigned as a different species from the lowland samples (Upham et al. 2013). Additional work on the morphology and genetics of M. hispidus will be needed to clarify its taxonomy.
Our results indicate that the alpha taxonomy of the tropical Andean rodents is still not fully resolved, for example with respect to delineation of species in the genera Chilomys and Mindomys. Also, COI sequences that we have obtained for the genera Thomasomys and Chilomys provide the first data from this marker for these genera, and may be useful for onward rodent barcoding efforts and for efforts toward a comprehensive multilocus phylogeny of thomasomyines, which remains an outstanding goal in Neotropical mammalogy (Salazar-Bravo and Yates 2007; Lee et al. 2011, 2015). While acknowledging its limitations, we encourage research teams studying Neotropical rodents to provide DNA barcoding data whenever possible, which may help to speed new species discoveries and taxonomic reviews in a highly diverse order in which many lines of basic taxonomic and inventory research remain open, active, and fruitful.


 nueva página del texto (beta)


