Introduction
The genus Nephelomys had been previously included in the genus Oryzomys and has been subject to taxonomic, systematic, and molecular studies in recent years, leading to the delimitation of species and new hypotheses about their phylogenetic relationships (e. g., Musser et al. 1998; Bonvicino et al. 2001; Percequillo 2003; Weksler 2003, 2006; Weksler et al. 2006).
Nephelomys comprises at least 13 taxa whose altitudinal distribution ranges from 900 to 4,000 masl (Weksler et al. 2006; Percequillo 2015). These rodents inhabit humid montane and cloudy forests in the Andes mountain range, from Bolivia to Colombia. They can also be found along the mountain ranges of northern Venezuela and in the Central American mountain ranges in Panama and Costa Rica (Aguilera et al. 1995; Percequillo 2003, 2015; Weksler et al. 2006; Anderson et al. 2012).
Three species, all included in the Nephelomys albigularis group (sensuWeksler et al. 2006), are currently known to occur in Venezuela, one being endemic to the country (García et al. 2019). Their geographical distribution is as follows: N. caracolus (endemic) has been recorded in the central and western portions of Cordillera de la Costa (Aguilera et al. 1995; Márquez et al. 2000; Percequillo 2003, 2015; Anderson and Raza 2010) and in the Lara-Falcón hill systems (Anderson et al. 2012); N. meridensis is found in the Andes at Cordillera de Mérida and the Tamá massif (Aguilera et al. 1995; Soriano et al. 1999; Márquez et al. 2000; Percequillo 2003, 2015; Anderson and Raza 2010); N. maculiventer was recently recorded in Sierra de Perijá (García et al. 2019). However, some authors recognize N. meridensis as a species complex, suggesting the existence of two additional taxa in the populations from the Venezuelan Andes (Aguilera et al. 1995; Rivas and Péfaur 1999a; Márquez et al. 2000; Percequillo 2003).
The use of geometric morphometrics on bony structures (mainly skulls) of cricetid rodents has increased lately as a means to examine intra- and interspecific morphological variation, and to identify and diagnose cryptic species within the group (Cordeiro-Estrela et al. 2006, 2008; García and Sánchez-González 2013; Astúa et al. 2015; Boroni et al. 2017; García et al. 2018). Geometric morphometrics is a biologically based statistical analysis method that decomposes variations in size and shape in a two- or three-dimensional space (Bookstein 1991).
Since the Andean populations of N. meridensis are considered as taxonomically unstable, we deemed appropriate to collect further evidence that might help to discriminate the species or subspecies currently clustered together into N. meridensis. In this work, skulls from Andean populations of this rodent were morphologically characterized and compared using geometric morphometrics techniques. Our objective was to contribute to the delimitation of potentially different taxa currently included within the N. meridensis complex of Venezuela.
Materials and Methods
We examined a total of 65 adult specimens (age class 3, as per the classification based on the molar wear pattern; Percequillo 2003) (Appendix 1). These specimens are deposited in the following Venezuelan collections: Museo de la Estación Biológica de Rancho Grande (EBRG, Aragua State), Museo de Historia Natural La Salle (MHNLS, Capital District) and the Colección de Vertebrados de la Universidad de los Andes (CVULA, Merida State).
Given the lack of sexual dimorphism, male and female specimens were pooled together for analyses (Rivas and Péfaur 1999a, b; Percequillo 2003). The specimens were then sorted into groups or morphotypes, according to their geographic distribution (Figure 1): N. meridensis (Mérida and adjacent areas), Cordillera de Mérida, Mérida State; N. meridensis A (Yacambú National Park), Cordillera de Mérida, Lara State; N. meridensis B (La Trampita), Uribante, Cordillera de Mérida, Táchira State; N. meridensis C (El Tamá), El Tamá massif, Táchira State; and N. meridensis D (Dinira National Park), Cordillera de Mérida, Lara and Trujillo States.
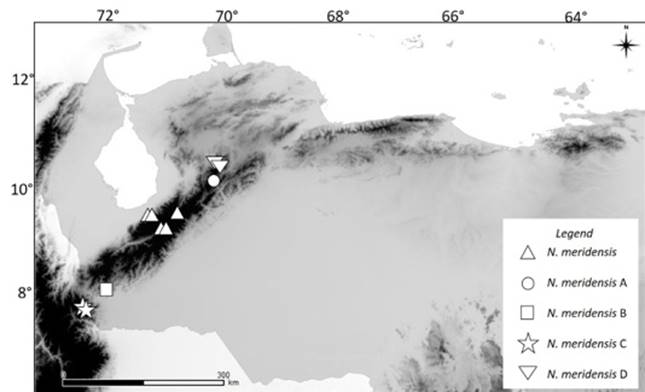
Figure 1 Geographic distribution of the Andean populations of the rodent Nephelomys in Venezuela. A darker coloration indicates an elevation higher than 1000 m above sea level.
Dorsal, ventral, and lateral views of each skull, as well as the labial view of the jaw, were selected for digitization. All photographs were captured by the same person using a digital camera Nikon D3000 16MP 24X and a tripod; a ruler graduated in millimetres was placed next to each skull as reference. Type-I and -II bidimensional homologous morphological landmarks were digitized (Bookstein 1991; Figure 2) using the software tpsDig (Rohlf 2006); the total number of landmarks digitized on each view were as follows: dorsal (12), ventral (15), lateral (11), and jaw (10). Landmark locations were selected to encompass the skull zones that have taxonomic diagnostic value for this group (Rivas and Péfaur 1999a, b; Márquez et al. 2000; Percequillo 2003). Landmark names correspond to those documented by Astúa et al. (2015).
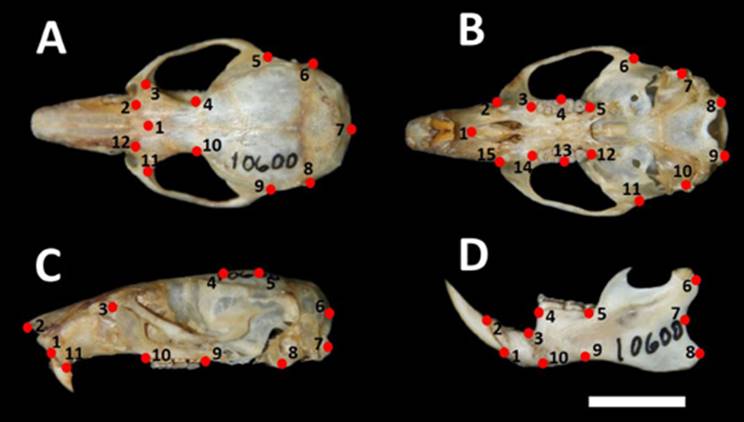
Figure 2 Position of the morphological landmarks selected in the different views of skulls from Andean populations of Nephelomys in Venezuela. A Dorsal view. B Ventral view. C Lateral view, and C Mandible. The reference scale is 10 mm.
Morphological landmarks were associated with Cartesian coordinates (x, y) that represent the geometric configuration of each skull. The coordinates were subject to a Procrustes adjustment, using the MorphoJ program, which removes the variations in size due to the position, orientation, and scale of each image (Klingenber 2011). Additionally, to detect a potential allometric correlation between the structures analysed, a Multivariate Regression Analysis (based on Goodall’s F statistic) was carried out, using the Regress7a program implemented in the series IMP7 (Sheets 2010). The independent variable was the centroid size and the dependent variables were the shape variables (Meloro et al. 2008).
The Procustes residuals produced two matrices; the partial deviations matrix was used for exploratory analyses (Canonical Variable and Discriminant Function analyses) aimed to identify correlations between the different groups in the morphospace, as well as their shape-related differences. These analyses were conducted using the IMP7 and MorphoJ programs. The groups formed based on the geographic distribution of specimens were used as a-priori groups for these analyses. The results from these analyses were estimates of Wilks’ λ and Mahalanobis and Procrustes distances, with their statistical significance evaluated by permutations tests with α ≤ 0.05; the a-priori groups were reclassified as per the Discriminant Function Analysis (in percentages) and evaluated with a cross-validation test (post hoc classification, also in percentages).
The second matrix was used to document isometric size by the centroid size, using the Past program (Hammer and Happer 2011). Centroid sizes in the different views were compared using a non-parametric Kruskal-Wallis test with the Bonferroni correction (P ≤ 0.05), as implemented in Past. Finally, MorphoJ (Klingenber 2011) was used to examine changes in shape in the different skull regions, by comparing the average shape superimposed on the groups.
Results
No significant correlation between centroid size and the shape variables was found in any of the skull views: dorsal (F20, 1220 = 2.235, P < 0.002, explained variation = 3.53 %); ventral (F26, 1482 = 4.091, P < 0.002, explained variation = 6.69 %); lateral (F18, 1098 = 3.339, P < 0.006, explained variation = 5.19 %); jaw (F16, 960 = 3.154, P < 0.002, explained variation = 3.53 %).
There were significant differences in the centroid size of some groups in the following views: Dorsal: N. meridensis - N. meridensis A, and N. meridensis A - N. meridensis B; Ventral: N. meridensis - N. meridensis A; N. meridensis - N. meridensis B; N. meridensis - N. meridensis C, and N. meridensis A - N. meridensis C; Jaw: N. meridensis A - N. meridensis B. These comparisons are detailed in in Table 1.
Table 1 Significant differences in the values of the centroid size estimator for Andean populations of Nephelomys meridensis in Venezuela. Descriptive statistics were tested with a probability value less than or equal to 0.05 (P ≤ 0.05). x = Arithmetic mean, δ = standard deviation. Values expressed in millimeters.
| Views of the Skull | x | δ | P |
|---|---|---|---|
| Dorsal | |||
| N. meridensis - N. meridensis A | 31.95-30.33 | 2.23-1.37 | 0.032 |
| N. meridensis A - N. meridensis B | 30.33-32.18 | 1.37-2.87 | 0.019 |
| Ventral | |||
| N. meridensis - N. meridensis A | 37.03-32.28 | 4.35-1.14 | 0.001 |
| N. meridensis - N. meridensis B | 37.03-33.52 | 4.35-1. 04 | 0.001 |
| N. meridensis - N. meridensis C | 37.03-33.71 | 4.35-1.04 | 0.005 |
| N. meridensis A - N. meridensis C | 32.28-33.71 | 1.14-1.04 | 0.037 |
| Mandible lateral wiew | |||
| N. meridensis A - N. meridensis B | 18.99-19.84 | 1.26-1.27 | 0.049 |
Figure 3 shows the separation of the groups in the morphospace, with the groups that are significantly different from each other in each view. In all views, the first two axes account for over 50% of the total variation: Dorsal view (variation = 73.01 %; Wilks’ λ = 0.2542; X 2 = 68.0873; d. f. = 38; P = 0.0002); ventral (variation = 76.59 %; Wilks’ λ = 0.1732; X 2 = 76.2631; d. f. = 52; P = 0.015); lateral (variation = 79.79 %; Wilks’ λ = 0.2241; X 2 = 77.0203 d. f. = 36; P = 0.0001) and jaw (variation = 79.18 %; Wilks’ λ = 0.2786; X 2 = 65.8128; d. f. = 32; P = 0.0003).
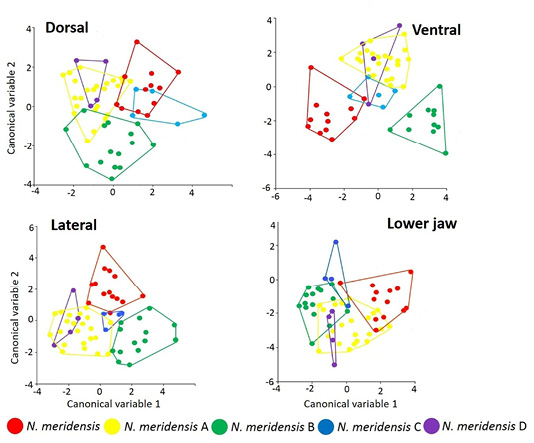
Figure 3 Factorial diagram of the Canonical Variable Analysis showing the spatial distribution and correlation between the different groups identified in the Andean populations of Nephelomys meridensis in Venezuela.
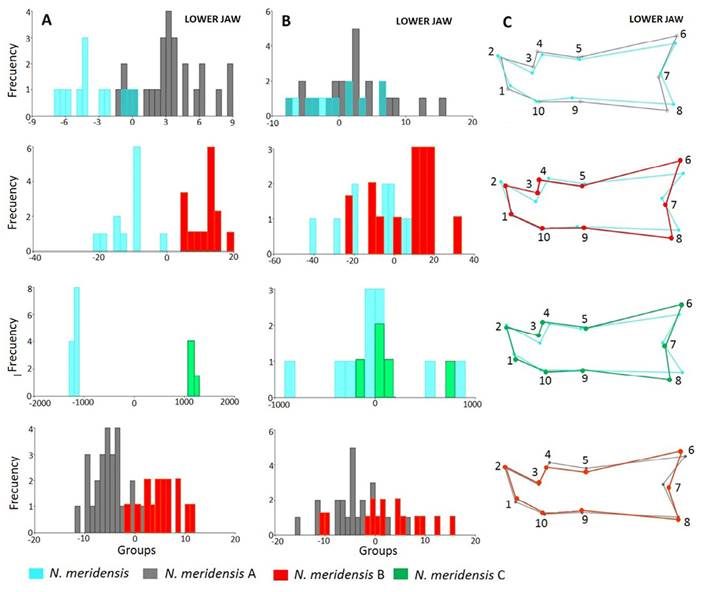
There were statistically significant differences in skull configuration between N. meridensis - N. meridensis A and N. meridensis A - N. meridensis B in all views (Table 2). The post hoc reclassification percentages of these groups were high, with N. meridensis A being better classified after the validation tests (Table 2). In addition, there were significant differences between N. meridensis and N. meridensis B in the ventral, lateral and jaw views; between N. meridensis A and N. meridensis C in the dorsal and lateral views; and between N. meridensis and N. meridensis C in the labial view of the jaw (Table 2). Figures 4 to 7 show the separation between these groups.
Table 2 Statistical comparison and subsequent differentiation between the different Andean populations of the genus Nephelomys (class 3) from Venezuela. Procrustes and Mahalanobis distances were tested with a value of P ≤ 0.05. The subsequent reclassification was tested with a cross-validation test, also with a value of P ≤ 0.05. The asterisk indicates statistically significant differences between groups.
| Views of the Skull | Procrustes distances | Mahalanobis distances | Reclassification discriminant function | Reclassification cross validation |
|---|---|---|---|---|
| Dorsal | ||||
| N. meridensis - N. meridensis A* | 0.02339096* | 3.7598* | 100 % - 100 % | 64 % - 75 % |
| N. meridensis - N. meridensis B | 0.02022337 | 5.7221 | 100 % - 100 % | 41 % - 73 % |
| N. meridensis - N. meridensis C | 0.02210766 | 5.0693 | 100 % - 100 % | 83 % - 40 % |
| N. meridensis - N. meridensis D | 0.01950156 | 1.8399 | 83 % - 100 % | 33 % - 33 % |
| N. meridensis A - N. meridensis B* | 0.01595765* | 3.1648* | 90 % - 94 % | 79 % - 63 % |
| N. meridensis A - N. meridensis C* | 0.01670396* | 3.1271* | 90 % - 87 % | 78 % - 66 % |
| N. meridensis A - N. meridensis D | 0.01166001 | 5.2342 | 100 % - 100 % | 67 % - 0 % |
| N. meridensis B - N. meridensis C | 0.02665050 | 7.1853 | 100 % - 100 % | 60 % - 86 % |
| N. meridensis B - N. meridensis D | 0.02479904 | 1.5076 | 80 % - 100 % | 80 % - 33 % |
| Ventral | ||||
| N. meridensis - N. meridensis A* | 0.02199053* | 8.2665* | 100 % - 100 % | 58 % - 93 % |
| N. meridensis - N. meridensis B* | 0.02218107* | 11.8822* | 100 % - 100 % | 75 % - 83 % |
| N. meridensis - N. meridensis C | 0.03218275 | 3.2676 | 91 % - 80 % | 91 % - 60 % |
| N. meridensis - N. meridensis D | 0.02115735 | 1.9478 | 83 % - 100 % | 58 % - 33 % |
| N. meridensis A - N. meridensis B* | 0.01669937* | 5.7588* | 100 % - 100 % | 82 % - 67 % |
| N. meridensis A - N. meridensis C | 0.02193730 | 4.5667 | 96 % - 100 % | 62 % - 0 % |
| N. meridensis A - N. meridensis D | 0.02081512 | 16.8012 | 100 % - 100 % | 74 % - 33 % |
| N. meridensis B - N. meridensis C | 0.02193730 | 4.5667 | 100 % - 91 % | 20 % - 58 % |
| N. meridensis B - N. meridensis D | 0.03506906 | 2.2241 | 100 % - 66 % | 100 % - 66 % |
| Lateral | ||||
| N. meridensis - N. meridensis A* | 0.02243218* | 5.1764* | 100 % - 100 % | 86 % - 93 % |
| N. meridensis - N. meridensis B* | 0.04068574* | 4.6594* | 100 % - 100 % | 50 % - 72 % |
| N. meridensis - N. meridensis C | 0.03906102 | 23.6338 | 100 % - 100 % | 50 % - 80 % |
| N. meridensis - N. meridensis D | 0.01788145 | 5.0564 | 100 % - 100 % | 50 % - 0 % |
| N. meridensis - N. meridensis B* | 0.03523493* | 4.1682* | 100 % - 100 % | 82 % - 72 % |
| N. meridensis A - N. meridensis C* | 0.03335329* | 6.4908* | 100 % - 100 % | 85 % - 80 % |
| N. meridensis A - N. meridensis D | 0.01985321 | 4.4808 | 100 % - 100 % | 70 % - 33 % |
| N. meridensis B - N. meridensis C | 0.01769165 | 31.2413 | 100 % - 100 % | 60 % - 78 % |
| N. meridensis B - N. meridensis D | 0.03622074 | 3.6542 | 100 % - 100 % | 80 % - 33 % |
| Mandible lateral wiew | ||||
| N. meridensis - N. meridensis A* | 0.02952130* | 2.6267* | 92 % - 85 % | 58 % - 70 % |
| N. meridensis - N. meridensis B* | 0.03814583* | 4.7765* | 100 % - 100 % | 75 % - 73 % |
| N. meridensis - N. meridensis C* | 0.03675974* | 48.3824* | 100 % - 100 % | 58 % - 80 % |
| N. meridensis - N. meridensis D | 0.03746015 | 11.8451 | 100 % - 100 % | 83 % - 33 % |
| N. meridensis A - N. meridensis B* | 0.02030497* | 3.2410* | 96 % - 93 % | 85 % - 67 % |
| N. meridensis A - N. meridensis C | 0.02402845 | 4.4597 | 100 % - 100 % | 85 % - 40 % |
| N. meridensis A - N. meridensis D | 0.02343556 | 2.3998 | 88 % - 75 % | 70 % - 33 % |
| N. meridensis B - N. meridensis C | 0.02817338 | 8.8376 | 100 % - 100 % | 80 % - 66 % |
| N. meridensis B - N. meridensis C | 0.03109383 | 2.5269 | 100 % - 75 % | 80 % - 50 % |
Regarding cranial morphology by view, the N. meridensis population from Mérida and adjacent areas differs from N. meridensis A by having a skull slightly longer in the posterior region (morphological landmarks 6 and 7; Figures 4C and 6C, respectively), with nasal bones slightly longer (landmark 2; Figure 6C). Maxillary toothrow slightly shorter (landmarks 9 and 10; Figure 6C); and palate wide between the incisive foramen (landmarks 2 and 15), narrow between the anterior base of the first molar (landmarks 3 and 14), the outer margin of the second molar (landmarks 4 and 13), and the posterior base of the last molar (landmarks 5 and 12; Figure 5C). Basicranium slightly wider at the posterior part of the zygomatic bones (landmarks 6 and 11) and the tympanic bullae (landmarks 7 and 10; Figure 5C). Jaw narrow and more extended, both on the anterior end (landmarks 1, 2 and 3), and by the coronoid and angular processes (landmarks 6 and 8; Figure 7C).
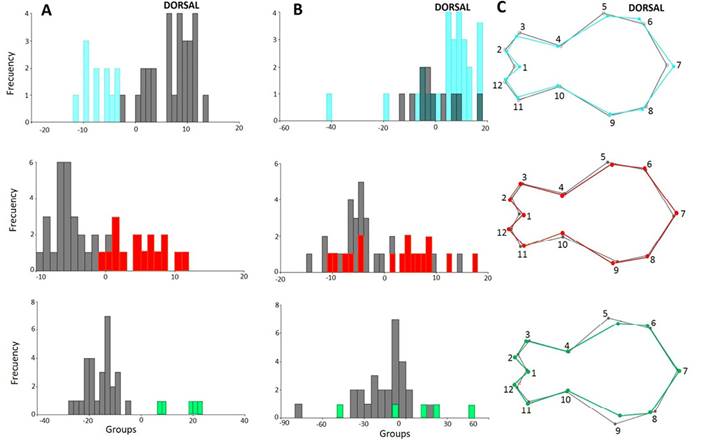
Figure 4 Visual representation of the skull differentiation (dorsal view) in Andean populations of the genus Nephelomys in Venezuela. A Histogram resulting from the Discriminant Function Analysis. B Histogram resulting from the cross-validation. C Between-group comparison of the average shape.
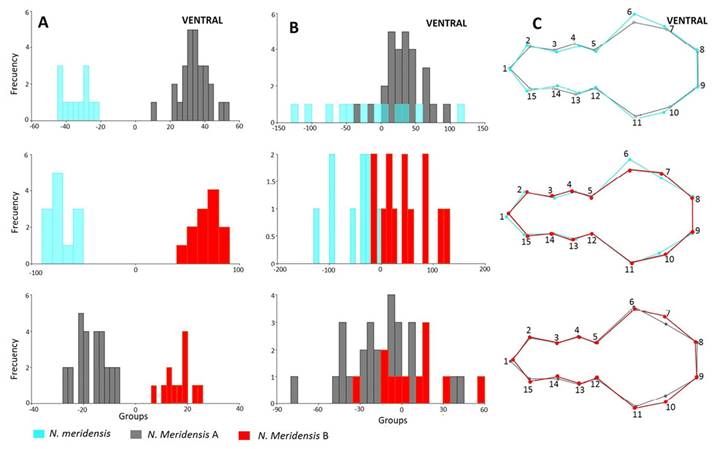
Figure 5 Visual representation of the skull differentiation (ventral view) in Andean populations of the genus Nephelomys in Venezuela. A Histogram resulting from the Discriminant Function Analysis. B Histogram resulting from the cross-validation. C Between-group comparison of the average shape.
Nephelomys meridensis differs from N. meridensis B in that the skull is lower in the parietal-interparietal region (landmarks 5, 6, 7 and 8) and has a longer nasal and premaxillae (landmarks 1, 2, and 11; Figure 6C). Maxillary toothrow (landmarks 9 and 10) slightly shorter (Figure 6C) and palate somewhat narrower between the first and second molars (landmarks 3, 14 and 4, 13; Figure 5C). Basicranium wide between the posterior bases of the zygomatic arches (landmarks 6 and 11) and narrow between the tympanic bullae (landmarks 7 and 10; Figure 5C). Jaw narrow and extended, both anteriorly (landmarks 2, 3 and 4) and in the posterior region by the coronoid and angular processes (landmarks 6 and 8; Figure 7C).

Figure 6 Visual representation of the skull differentiation (lateral view) in Andean populations of the genus Nephelomys in Venezuela. A Histogram resulting from the Discriminant Function Analysis. B Histogram resulting from the cross-validation. C.Between-group comparison of the average shape.
Nephelomys meridensis differs from N. meridensis C only in its jaw (Figure 7C), which is narrower in the posterior region of the diastema (landmarks 3 and 4) and has extended angular processes aligned with the coronoid processes (landmarks 6 and 8).
The frontal bones of Nephelomys meridensis A are slightly wider (landmarks 1, 3 and 11) than those of N. meridensis B towards the anterior region (Figure 4C). Interorbital region (landmarks 4 and 10) slightly wider in N. meridensis A (Figure 4C). Posterior part of the skull in the interparietal region (landmarks 5, 6, 7 and 8) higher in Nephelomys meridensis B than in N. meridensis A (Figure 6C). Both groups share a maxillary toothrow (landmarks 9 and 10) of similar length (Figure 6C) and a similar morphology in the posterior part of the palate (between the incisive foramen and between the anterior base of the first molar and the posterior base of the last molar; landmarks 2, 3, 4, 5, 12, 13, 14 and 15, Figure 5C). Basicranium of N. meridensis A narrower between the bullae (landmarks 7 and 10; Figure 5C) and jaw similar in both groups in the anterior region (in the incisors alveoli), but a little higher at the toothrow base (landmarks 4 and 5) and narrow towards the posterior part, with the coronoid processes (landmark 6) more extended in N. meridensis A (Figure 7C).
Nephelomys meridensis A and N. meridensis C differed from each other in skull metrics; skull of N. meridensis A wider in the posterior part of the zygomatic arches (landmarks 5 and 9; Figure 4C), with longer nasal bones (landmark 2), and posterior part of the skull narrower (landmarks 5, 6, 7 and 8; Figure 6C).
Discussion
Our results show that specimens from the type locality of Nephelomys meridensis exhibit a cranial conformation different from that of other populations of the Venezuelan Andes (Yacambú National Park [Cordillera de Mérida, Lara State]), La Trampita [Cordillera de Mérida, Mérida State] and El Tamá massif, Táchira State, respectively). The population herein referred to as N. meridensis D (Dinira National Park) was not different, in any of the views, from the other groups compared, contrary to the results obtained by Rivas and Péfaur (1999a) using morphometrics based on linear distances.
The clear separation and differentiation of the cranial model in most populations currently recognized as monotypic within N. meridensis provides further evidence supporting the hypothesis that this taxon should be treated as a species complex (Rivas and Péfaur 1999a; Soriano et al. 1999; Márquez et al. 2000). In its current delimitation, N. meridensis could include at least one species (karyotype 2n = 66, FN = 92, occurring in the La Trampita and El Tamá localities in Venezuela and Colombia; Aguilera et al. 1995; Márquez et al. 2000; Percequillo 2003, 2015) and two new subspecies (one from Yacambú National Park, with the same karyotype that the Mérida populations: 2n = 66, FN = 104; Aguilera et al. 1995; Rivas and Péfaur 1999a; Márquez et al. 2000 and another in the Tamá populations, as per the morphological differences described in this work).
Our morphogeometric data are consistent with morphometrics studies based on linear distances on skulls of Nephelomys rodents (Rivas and Péfaur 1999a; Percequillo 2003). Percequillo (2003) studied the systematics of the Nephelomys albigularis group and suggested that the El Tamá population should correspond taxonomically to the La Trampita population (although he did not examine specimens from the latter locality). Rivas and Péfaur (1999a) explored the geographic variation in skulls of specimens of the genus Nephelomys from Venezuela using multivariate analyses; their results supported the differentiation of the populations from Yacambú National Park and Mérida. Our results using geometric morphometrics demonstrate the validity of this tool for taxonomic studies and for the identification or detection of cryptic species (Cordeiro-Estrela et al. 2006, 2008; Astúa et al. 2015; Boroni et al. 2017).
From a biogeographic viewpoint, the Andes is considered a mega-diverse region that harbors a high species richness and a high level of endemisms of flora and fauna (Josse et al. 2009). The Venezuelan Andean system encompasses three mountain ranges: Sierra de Perijá, El Tamá massif (which are part of the eastern Andes of Colombia), and Cordillera de Mérida (Soriano et al. 1999). Cordillera de Mérida is the main mountain range of the Venezuelan Andean system; it is approximately 400 km long by 80 km wide and runs in a southwest-northeast direction starting at the Táchira depression and ending at the Barquisimeto depression (La Marca 1997). The Táchira depression separates Cordillera de Mérida from the Colombian Andes; its particular conditions of low elevation (< 1,000 m above sea level), high temperature, and arid (deciduous and xerophytic) vegetation likely function as ecological and geographic barriers that may foster isolation and speciation of some mammalian taxa (e.g., shrews of the genus Cryptotis; Woodman 2002). However, it has been reported that the Táchira depression does not act as a natural barrier restraining gene flow in other mammals (Gutiérrez et al. 2015).
Cordillera de Mérida encompasses various mountain formations and branches, the most important being Sierra Nevada de Mérida, Sierra de La Culata, Cordillera de Trujillo, Guaramacal massif, Sierra de Barbacoas, and Sierra de Portuguesa (La Marca 1997). These branches are separated by valleys or depressions that may also act as natural barriers (as is the case of the Táchira depression), thus preventing the dispersal and promoting vicariant speciation of rodents of the genus Nephelomys. The recent description of the species Aepeomys reigi (Rodentia: Cricetidae), which had been previously included in Aepeomys lugens (Ochoa et al. 2001), and Cryptotis dinirensis (Eulipotyphla: Soricidae), previously included in Cryptotis meridensis (Quiroga-Carmona and Do Nascimiento 2016), are clear examples of evolutionary processes in small non-flying mammals that took place in Cordillera de Mérida.
Finally, our work highlights the need to gather complete wildlife inventories in biogeographically important zones of the Venezuelan Andes, such as Sierra de Perijá, where the presence of N. maculiventer was recently reported (García et al. 2018); the protected areas of the Venezuelan System of National Parks located in Cordillera de Mérida (e.g., Dinira National Park, Guache, Páramo Batallón and la Negra, etc.); as well as other areas within the distribution range of the non-Andean species N. caracolus in Cordillera de la Costa and the Lara-Falcón hill systems in northern Venezuela. This would allow obtaining a more representative sample that could be used for comprehensive taxonomic reviews using a combination of (geometric and linear) morphometrics techniques, analyses of morphological characters, cytogenetics and DNA sequencing, as well as biogeographic and niche-modeling studies (Anderson and Raza 2010).


 nueva página del texto (beta)

