Introduction
The heterogenous topography of southern México, and Pleistocene climatic changes, generated complex biogeographic patterns and high species diversity in vertebrates (León-Paniagua and Morrone 2009; Morrone 2017), especially in small mammals (Vallejo and González-Cózatl 2012; Guevara and Cervantes 2014; León-Paniagua and Guevara 2019). Many of the region’s mammals possess conservative morphologies; therefore, the number of species and their phylogenetic relationships are not entirely understood (Sullivan et al. 1997; Ordóñez-Garza et al. 2014; Pérez-Consuegra and Vázquez-Domínguez 2015, 2017). Without an adequate taxonomy, it is impossible to understand fundamental aspects of the processes that generate and maintain biodiversity (Upham et al. 2019).
Woodrats of the genus Neotoma comprise at least 24 species, distributed across portions of southern Canada and most of the continental United States and México, reaching Central America (Edwards and Bradley 2002a; Longhofer and Bradley 2006; Pardiñas et al. 2017). Although Neotoma has been studied for almost 200 years, phylogenetic relationships and species limits are not entirely resolved (Edwards and Bradley 2002a; Longhofer and Bradley 2006; Matocq et al. 2007; Ordóñez-Garza et al. 2014) because some species and subspecies are rare and/or have restricted distributions that are poorly sampled (Rogers et al. 2011; Fernández 2014).
Taxonomic revisions (Merriam 1894; Goldman 1910) divided woodrats into several species groups, with only the N. mexicana species group reaching southern México and Central America (Pardiñas et al. 2017). The N. mexicana species group, as defined by Goldman (1910), included eight species: N. chrysomelas, N. distincta, N. ferruginea (with subspecies N. f. ferruginea, N. f. chamula, N. f. isthmica, N. f. ochracea, N. f. picta, N. f. solitaria, and N. f. tenuicauda), N. mexicana (subspecies N. m. mexicana, N. m. bullata, N. m. fallax, N. m. madrensis, N. m. pinetorum, and N. m. sinaloae), N. navus, N. parvidens, N. torquata, and N. tropicalis. Subsequently, N. f. griseoventerDalquest, 1951; N. f. vulcaniSanborn, 1935; N. m. atrataBurt, 1939; N. m. eremitaHall, 1955; N. m. inopintaGoldman, 1933; N. m. inornataGoldman, 1938; and N. m. scopulorumFinley, 1953 were also described. However, all species and subspecies in the N. mexicana species group, except N. chrysomelas, were relegated to subspecific status within N. mexicana by Hall (1955), and later, Anderson (1972) synonymized the subspecies N. m. madrensis with N. m. mexicana. As defined by these revisions, the N. mexicana species group inhabits montane areas from northern Colorado throughout much of New México and western Arizona south to western Nicaragua (Edwards and Bradley 2002b; Ordóñez-Garza et al. 2014).
Although several studies have investigated the phylogenetic relationships among Neotoma species (Edwards and Bradley 2002a; Longhofer and Bradley 2006; Matocq et al. 2007), only two have focused on the N. mexicana species group (Edwards and Bradley 2002b; Ordóñez-Garza et al. 2014). Using mitochondrial cytochrome b (cyt-b) sequences, Edwards and Bradley (2002b), and Ordóñez-Garza et al. (2014) concluded that this species group includes at least the species N. mexicana from the United States through northern and central México and south of the Transmexican Volcanic Belt in southeastern México and Central America, N. picta in the Sierra Madre del Sur from Guerrero, N. ferruginea from western portions of the Isthmus of Tehuantepec south to El Salvador, and Neotoma chrysomelas, which inhabits parts of Honduras and Nicaragua (Pardiñas et al. 2017). After these taxonomic changes, 19 subspecies of N. mexicana and four subspecies of N. ferruginea are recognized, whereas N. picta and N. chrysomelas are monotypic (Pardiñas et al. 2017).
Despite the progress on the systematics and phylogenetic relationships in the N. mexicana species group, no samples of some subspecies have been analyzed with genetic data. These include N. m. parvidens, N. m. tropicalis from Oaxaca, or N. m. solitaria from Central America, and these three subspecies, with disjunct geographic ranges, have remained in N. mexicana (Edwards and Bradley 2002b; Ordóñez-Garza et al. 2014; Pardiñas et al. 2017; Figure 1). Nevertheless, Edwards and Bradley (2002b) suggested that individuals from southeastern Oaxaca and east of the Isthmus of Tehuantepec (possibly including N. m. solitaria from Guatemala and Honduras) are N. ferruginea, specimens from the Sierra Madre del Sur in Guerrero (and possibly including N. m. parvidens from the Sierra Sur de Oaxaca) are N. picta, and all samples in northern Oaxaca (possibly including N. m. tropicalis from Sierra Norte de Oaxaca and hills near the Chiapas border) represent N. mexicana. These taxonomic hypotheses, which placed the boundaries among the ranges of N. mexicana, N. ferruginea, and N. picta near the Isthmus of Tehuantepec, relied on the biogeographic recognition of this lowland area as an essential barrier that has promoted speciation in many other highland mammals species (Woodman and Timm 1999; Arellano et al. 2005; León-Paniagua et al. 2007; Ordóñez-Garza et al. 2010).
Herein, we use samples of N. m. parvidens and N. m. tropicalis from the western Isthmus of Tehuantepec (Figure 1) to test the taxonomic affinity of these subspecies. Neotoma m. parvidens and N. m. tropicalis are geographically isolated from other populations of N. mexicana (Figure 1). The type locality of N. m. parvidens is “Juquila, Oaxaca, México” and the N. m. parvidens sample (MZFC 11029) is from the same location: La Yerbabuena, Santa Catarina Juquila, Oaxaca (Figure 1). The type locality of N. m. tropicalis is the northeastern Oaxacan mountains (Goldman 1910) in Totontepec (Goldman 1904). This subspecies only occurs in the Sierra Norte de Oaxaca and hills near the Chiapas border, and no other Neotoma inhabit this area (Ordóñez-Garza et al. 2014; Pardiñas et al. 2017). The N. m. tropicalis sample (MZFC 8088) is from Xiacaba, 6.5 km ESE de Santa María Yavesía, Santa María Yavesía, Oaxaca, in the Sierra Norte de Oaxaca, around 36 km west of the type locality (Figure 1).
We sequenced the mitochondrial cyt-b because of its availability from a broad range of N. mexicana samples (Edwards and Bradley 2002b; Ordóñez-Garza et al. 2014), and its proven utility to clarify relationships in Neotoma (Edwards and Bradley 2002a) and closely related genera (Amman and Bradley 2004; Arellano et al. 2005; Bradley et al. 2007, 2017, 2019; León-Tapia 2013; Rogers et al. 2007; Vallejo and González-Cózatl 2012).
Materials and methods
We sequenced 1,143 base pairs of the mitochondrial cyt-b in specimens of N. m. parvidens (n = 1), N. m. tropicalis (n = 1), N. m. tenuicauda (n = 2), and N. leucodon (n = 1). We examined the external and cranial morphology of these specimens to confirm their taxonomic identity (Goldman 1904, 1910). Voucher specimens are deposited in the mammal collection of the Museo de Zoología, Facultad de Ciencias, Universidad Nacional Autónoma de México, Ciudad de México, México (MZFC; Appendix I). We also downloaded twenty-five sequences from GenBank: N. mexicana (n = 15), N. picta (n = 2), N. ferruginea (n = 7), and N. stephensi (n = 1; Appendix I; Edwards and Bradley 2002b; Ordóñez-Garza et al. 2014).
Molecular protocols. We extracted whole genomic DNA using a Qiagen DNEasy Blood and Tissue kit (Qiagen, Germantown, Maryland), following the manufacturer’s recommended protocols. Through polymerase chain reaction (PCR), we amplified the complete cyt-b using the primers MVZ05 (Smith and Patton 1993) and H15915 (Irwin et al. 1991). Each PCR had a final reaction volume of 13 μL and contained 6.25 μL of GoTaq Green Master Mix (Promega, Madison, WI, USA), 4.75 μL of H20, 0.5 μL of each primer [10μM], and 1 μL of DNA stock. The PCR thermal profile included 2 minutes of initial denaturation at 95°C, followed by 38 cycles of 30 seconds of denaturation at 95°C, 30 seconds of annealing at 50°C, and 68 seconds for the extension at 72°C. We included a 5-minute final extension step at 72°C. We visualized 3 μL of each PCR product using electrophoresis in 1% agarose gels, stained with SYBR Safe DNA Gel Stain (Life Technologies, Carlsbad, CA, USA). Each PCR product was then cleaned with 1 μL of a 20 % dilution of ExoSAP-IT (GE Healthcare Bio-Sciences Corp. Piscataway, NJ, USA) incubated for 30 minutes at 37°C followed by 15 minutes at 80°C. Samples were cycle-sequenced using 6.1 μL of H20, 1.5 μL of 5x buffer, 1 μL of 10μM primer, 0.4 μL of ABI PRISM Big Dye v. 3.1 (Applied Biosystems, Foster City, CA, USA), and 1 μL of the cleaned template. The cycle-sequencing profile included 1 minute of initial denaturation at 96°C, followed by 25 cycles of 10 seconds for denaturation at 96°C, 5 seconds for annealing at 50°C, and 4 minutes for the extension at 60°C. Cycle sequencing products were purified using an EtOH-EDTA precipitation protocol and were read with an ABI 3130xl genetic analyzer (Applied Biosystems, Foster City, CA, USA). DNA sequences were edited, aligned, and visually inspected using Mega X (Kumar et al. 2018) and FinchTV 1.4 (Patterson et al. 2004).
Phylogenetic relationships. We used maximum likelihood (ML) and Bayesian inference (BI) to estimate the N. mexicana species group’s phylogenetic relationships. We analyzed a total of 28 individuals in the N. mexicana species group with N. leucodon and N. stephensi as outgroups. We used both external groups because it is not clear if N. stephensi, or the clade that includes the species groups N. floridana + N. lepida + N. micropus (that includes N. leucodon), is sister to the N. mexicana species group (Matocq et al. 2007). In PartitionFinder 2 (Lanfear et al. 2016), we selected the best model and partition scheme (maximally divided by codon position) among all available models in MrBayes 3.2 (Ronquist et al. 2012), using the Bayesian Information Criterion (BIC). We used this result for both ML and BI. In IQ-TREE 1.6.12 (Nguyen et al. 2015), we estimated the ML gene tree, with branch support estimated by 1,000 replicates of nonparametric bootstrap. In MrBayes 3.2 we used three hot chains and one cold chain in two independent runs of 10 million generations, sampling data every 1,000 iterations. We checked for convergence of MCMC results by examining trace plots and sample sizes in Tracer 1.7 (Rambaut et al. 2018). The final topology was obtained using a majority rule consensus tree and considering a burn-in of 25 % (with effective sample sizes > 200).
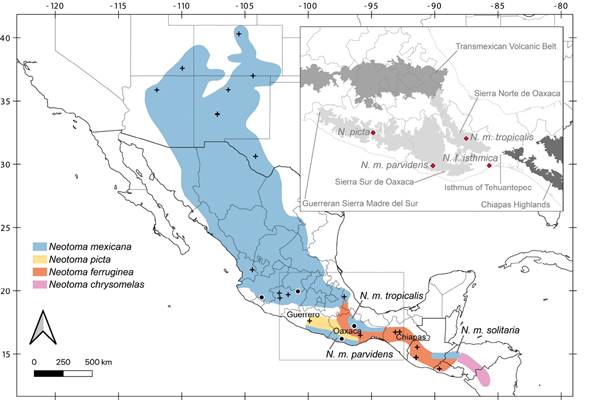
Figure 1 Specimens analyzed in this study. Black circles represent samples sequenced in this work, whereas black crosses indicate previously published sequences. Map colors show previously suggested geographic ranges for the N. mexicana species group (Edwards and Bradley 2002b; Pardiñas et al. 2017). The inset shows all type localities from Guerrero and Oaxaca (red diamonds) and the main biogeographic regions. Localities of samples included in this work: N. m. parvidens, México: Oaxaca; Santa Catarina Juquila, La Yerbabuena (MZFC 11029); N. m. tenuicauda, México: Colima; Comala, La Yerbabuena (MZFC 11989); Michoacán; Zinapécuaro, Araró, Campo Alegre (MZFC 12327); N. m. tropicalis, México: Oaxaca; Santa María Yavesía, Xiacaba, 6.5 km ESE de Santa María Yavesía (MZFC 8088).
To test whether our inferred best topologies are statistically superior to past taxonomic hypotheses, we constrained topologies to fit taxonomy (forcing the monophyly of N. m. parvidens or N. m. tropicalis and all other N. mexicana samples) and analyzed these in MrBayes 3.2 (same settings as above). To compare the unconstrained BI and the constrained topologies, we used the Shimodaira-Hasegawa test (Shimodaira and Hasegawa 1999) as implemented in the package phangorn 2.5.5 (Schliep 2011) for R 3.6.2 (R Core Team 2014). We compared the likelihood fits assuming an HKY+G substitution model and 10,000 bootstrap replicates. We performed analyses with and without optimizing the rate matrices and base frequencies.
Genetic differentiation and genetic diversity. To evaluate differentiation levels among members of the N. mexicana species group, we calculated p-distances in Mega X, using the pairwise deletion option and the Kimura 2-parameter model (Kimura 19804). These settings were chosen to facilitate comparisons with previous works (Bradley and Baker 2001; Baker and Bradley 2006; Ordóñez-Garza et al. 2014). To clarify whether intraspecific variation was correlated with geography, we performed a Mantel test on genetic distances (previously calculated in Mega) and Euclidean geographic distances in the R package adegenet 2.1.3 (Jombart 2008; Jombart and Ahmed 2011). The Mantel test’s significance was assessed using 99,999 permutations, and plots were colored by 2-dimensional kernel density estimation in the R package MASS 7.3-51.4 (Venables and Ripley 2002). To further characterize genetic diversity, we used DnaSP 5.10 (Librado and Rozas 2009) to calculate the number of segregating sites, the number of haplotypes, haplotype diversity (Hd), and nucleotide diversity (π) for each species.
Results
Our alignment covered 100 % in > 97 % of positions, contained 290 variable characters, and 196 parsimony-informative characters. The best evolutionary model scheme was K80+G, HKY+I, and GTR+I applied to the first, second, and third codon positions, respectively. Topologies from ML and BI trees were similar (Figure 2), revealing well-supported sister relationships between N. picta (from the Guerreran Sierra Madre del Sur) and N. ferruginea (Oaxaca to Central America; ML and BI), with this clade sister to N. mexicana (from the United States to the Transmexican Volcanic Belt in central México; BI only). Our samples of N. m. parvidens (MZFC 11029) and N. m. tropicalis (MZFC 8088) were closely related to N. ferruginea rather than N. mexicana. The constrained analyses, which forced these subspecies to be members of N. mexicana, produced significantly worse likelihoods in both cases, with the optimized (P < 0.001 for each subspecies) and not optimized (P < 0.001 for each subspecies) data. Hence, the Shimodaira-Hasegawa test strongly rejected the placement of N. m. parvidens and N. m. tropicalis in N. mexicana (Table 1). In the following analyses, we included both specimens (MZFC 11029 and 8088) in N. ferruginea.
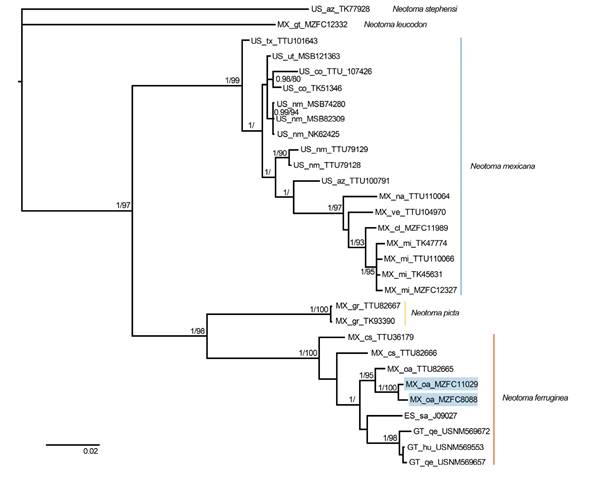
Figure 2 Majority rule consensus tree of the Neotoma mexicana species group, obtained from Bayesian analysis of cytochrome b sequences. Support values are shown as posterior probabilities followed by bootstrap values from a maximum likelihood analysis. Support values < 0.8/80 are not shown. Samples of N. m. parvidens (MZFC 11029) and N. m. tropicalis (MZFC 8088) are denoted with blue boxes within N. ferruginea. Tip labels show country (ES = El Salvador, GT = Guatemala, MX = México, US = the United States), states/provinces (sa = Santa Ana; hu = Huehuetenango, qe = Quetzaltenango; cl = Colima, cs = Chiapas, gr = Guerrero, gt = Guanajuato, mi = Michoacán, na = Nayarit, oa = Oaxaca, ve = Veracruz; az = Arizona, co = Colorado, nm = New Mexico, tx = Texas, ut = Utah), and catalog number.
The average mitochondrial distance between N. mexicana and N. picta was 9.68 % (range = 8.97 to 10.1), between N. mexicana and N. ferruginea was 9.46 % (range = 8.02 to 10.81), and between N. picta and N. ferruginea was 7.94 % (range = 7.79 to 7.98). Within species, the average genetic distance between the Chiapan and all other samples in N. ferruginea was 2.91% (range = 2.05 to 3.3), and between the Mexican and the United States N. mexicana samples was 3.86 % (range = 3.15 to 4.83; Figure 3). The Mantel tests revealed significant isolation by distance among N. mexicana (P = 0.00001, R2 = 0.8351) and N. ferruginea (P = 0.00844, R2 = 0.1907; Figure 4). Finally, in N. mexicana and N. ferruginea we found high haplotype diversity values (Hd = 0.978 and 1, respectively), but within each species, all haplotypes were similar (π = 0.025 and 0.023, segregating sites = 99 and 72, respectively). In N. picta the two analyzed specimens had the same haplotype (Table 2).
Table 1 Results of Shimodaira-Hasegawa tests of alternative phylogenetic hypotheses (unconstrained = obtained in this work from BI, constrained = monophyly of N. m. parvidens or N. m. tropicalis forced with all other N. mexicana samples), with and without optimizing the rate matrices and base frequencies. Asterisks indicate statistical rejection of topological equivalence (α = 0.05).
| No optimization | Optimization | |||||
|---|---|---|---|---|---|---|
| In L | ∂ L | P | In L | ∂ L | P | |
| Unconstrained | -4568.9 | 0.000 | 0.4965 | -4089.1 | 0.000 | 0.4967 |
| Constrained | -4684.6 | 115.665 | 0.0000* | -4137.5 | 48.405 | 0.0000* |
| (N. m. parvidens) | ||||||
| Constrained | -4683.2 | 114.291 | 0.0000* | -4136.8 | 47.736 | 0.0001* |
| (N. m. tropicalis) |
Table 2 Genetic diversity summary statistics for species in the Neotoma mexicana species group. n = sample size, S = number of segregating sites, h = number of haplotypes, Hd = haplotype diversity, π = nucleotide diversity, SD = standard deviation.
| n | S | h | Hd | SD (Hd) | π | SD (π) | |
|---|---|---|---|---|---|---|---|
| Neotoma mexicana | 17 | 99 | 15 | 0.978 | 0.031 | 0.025 | 0.002 |
| Neotoma picta | 2 | 0 | 1 | 0 | 0 | 0.000 | 0.000 |
| Neotoma ferruginea | 9 | 72 | 9 | 1 | 0.052 | 0.023 | 0.003 |
Discussion
Although woodrats are regionally typical, taxa in the N. mexicana group are poorly known regarding their systematics and ecology (Edwards and Bradley 2002b). Previous analyses pointed out the possibility that the Isthmus of Tehuantepec promoted diversification in this species group because individuals from the eastern Isthmus were assigned to N. ferruginea, those from the Guerreran Sierra Madre del Sur and, possibly from Sierra Sur the Oaxaca, were referred to N. picta, and individuals from northern Oaxaca were designated N. mexicana (Edwards and Bradley 2002b). However, our results reject these taxonomic hypotheses. We found that N. ferruginea is paraphyletic, both N. m. parvidens from the Sierra Sur de Oaxaca and N. m. tropicalis from Sierra Norte de Oaxaca are related to N. ferruginea rather than N. mexicana or N. picta. For taxonomy to reflect evolutionary history, the parvidens and tropicalis subspecies should be considered populations of N. ferruginea. With these taxonomic modifications, species boundaries in the N. mexicana species group no longer lie near the Isthmus of Tehuantepec, and N. ferruginea spans this biogeographic barrier. As such, we find no evidence that the isthmus promoted speciation or maintains long-term geographic isolation in this species group. Our conclusions are based on high levels of mitochondrial DNA divergence and backed by morphological evidence (see below), but should be further tested in future works using independently sorting nuclear loci.
Our placement of parvidens and tropicalis in N. ferruginea (Figures. 2, 3, 4, Table 1) is consistent with Goldman’s (1910) conclusions. Although N. f. parvidens and N. f. tropicalis were considered independent species in his monograph, he described both taxa as members of the “ferruginea section” inhabiting mountain slopes of southwestern and northeast Oaxaca, respectively (Goldman 1910). The geographic ranges we suggest herein eliminate some of the previously proposed geographic disjunctions, and they align well with some common biogeographic boundaries. Firstly, the southern geographic limit of N. mexicana is located in the Transmexican Volcanic Belt (Figure 5), a biogeographic barrier to many other Nearctic species (Morrone 2019). We detected intraspecific genetic variation consistent with isolation by distance (Figures 3 and 4A). Secondly, in southern México, Neotoma picta, N. f. parvidens, and N. f. tropicalis inhabit the eastern Sierra Madre del Sur sub-province, because the Sierra Sur de Oaxaca and the Sierra Norte de Oaxaca are also part of the eastern Sierra Madre del Sur. A recent biogeographical study of the eastern Sierra Madre del Sur suggested that it comprises two areas, the Guerreran and the Oaxacan Highlands districts, each one supported by many local endemic taxa (Santiago-Alvarado et al. 2016; Morrone 2017). We suggest that N. picta inhabits the Guerreran district of the Eastern Sierra Madre del Sur sub-province, whereas N. ferruginea inhabits a large area from the Oaxacan highlands district across the Isthmus of Tehuantepec to Central America (Figure 5).
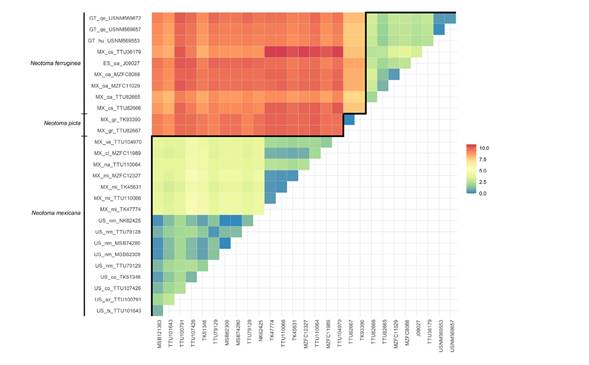
Figure 3 Heat map showing Kimura 2-parameter genetic distances in the N. mexicana species group. Interspecific and intraspecific comparisons are shown above and below the black line, respectively. Geographic information is shown on the y-axis (ES = El Salvador, GT = Guatemala, MX = México, US = the United States; sa = Santa Ana; hu = Huehuetenango, qe = Quetzaltenango; cl = Colima, cs = Chiapas, gr = Guerrero, gt = Guanajuato, mi = Michoacán, na = Nayarit, oa = Oaxaca, ve = Veracruz; az = Arizona, co = Colorado, nm = New Mexico, tx = Texas, ut = Utah).
A previous dated phylogenetic analysis inferred Late Pleistocene diversification in the N. mexicana group and suggested that habitat expansion and contraction promoted diversification (Ordóñez-Garza et al. 2014). We detected low levels of nucleotide diversity but high levels of haplotype diversity (Table 2), a pattern consistent with recent demographic expansions (Hedrick 2011), so the hypothesized effect of Pleistocene habitat cycles on this species group is consistent with our results. Additionally, we found intraspecific genetic differentiation from 1.68 to 3.58 % in N. ferruginea across the Isthmus of Tehuantepec. These lowlands are a minimally 200-km-wide valley at approximately 250 meters above sea level (Barrier et al. 1998), representing a significant barrier for many montane species (Peterson et al. 1999). However, the Isthmus of Tehuantepec did not promote speciation in these woodrats because its genetic differentiation seems more related to geographic distances rather than geographic barriers (Figure 4B), there is not a clear and supported geographic structure in the phylogenetic inferences (Figure 2), and because the most different individuals were detected in Chiapas and not between eastern and westernmost populations (Figure 3). Interestingly, a Chiapan Pleistocene refugium has been suggested in other mammal studies (Guevara-Chumacero et al. 2010; Gutiérrez-García and Vázquez-Domínguez 2012). Future phylogeographic studies on N. ferruginea could test for signals of a Pleistocene refuge in the highlands of Chiapas, which could have served as a source for the Oaxacan and Central American populations.
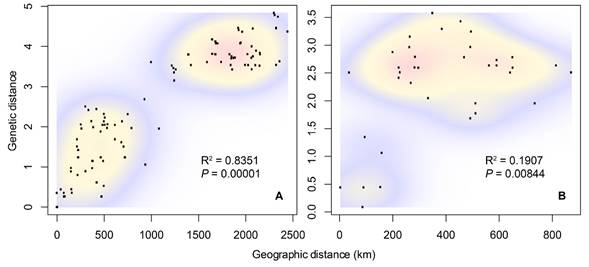
Figure 4 Bi-variate plots of geographic and genetic distances of A) Neotoma mexicana, and B) Neotoma ferruginea. Warmer colors indicate higher point densities. Mantel test results are shown.
Finally, N. m. solitaria from Guatemala and Honduras’s uncertain placement, as a subspecies of N. mexicana or N. ferruginea has been previously mentioned (Ordóñez-Garza et al. 2014; Pardiñas et al. 2017). Neotoma m. solitaria was initially described as a subspecies of N. ferruginea with a small body size, and short, bright fur (Goldman 1905), but it was relegated to subspecific status within N. mexicana by Hall (1955) without a formal analysis. Subsequent revisions on the N. mexicana species group showed that the lumping of its members obscured the real diversity and evolutionary history of these woodrats (Edwards and Bradley 2002b; Ordóñez-Garza et al. 2014). Although we did not analyze samples of N. m. solitaria, previous morphological descriptions (Goldman 1910), and the geographic ranges of the N. mexicana species group members (Figure 5) suggest the best available option is to re-assign N. m. solitaria to N. ferruginea.
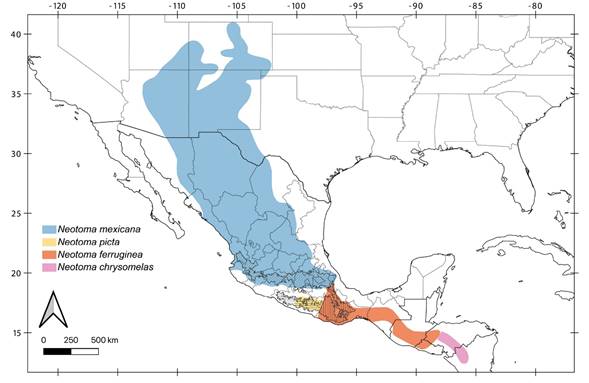
Figure 5 Revised geographic ranges within the N. mexicana species group. Guerreran Sierra Madre del Sur district is shown as horizontal hashes, Oaxacan highlands district as vertical hashes, and Transmexican Volcanic Belt with diagonal hashes (Morrone 2017).
Although our results rely on a small data set, the inclusion of novel samples from type localities improved resolution of the evolutionary history and geographic limits of N. mexicana species group members. The species ranges we propose are geographically coherent and separated by standard biogeographic boundaries. A continued sampling of wild populations is needed to provide a rigorous understanding of southern Mexican mammals’ diversity and endemism.


 nueva página del texto (beta)


