Introduction
The biota on islands is particularly prone to extinction (Whittaker et al. 2017) and extirpation due to their small population sizes, low genetic diversities, less opportunity to recover by recolonization, higher levels of endemism compared to continents, and susceptibility to stochastic processes. For example, 75 % of land vertebrate extinctions have occurred on islands (Tershy et al. 2015). However, islands are also known for their unique biodiversity (Whittaker and Fernández-Palacios 2007) and high levels of endemism (Weigelt et al. 2015). The Bawean island, a remnant of a small volcano in the Java Sea (Meijaard 2003), hosts two endemic ungulates, the Bawean deer (Axis kuhlii) and the Bawean warty pig (Sus verrucosus blouchi) and two endemic raptors, the Bawean serpent eagle (Spilornis cheela baweanus) and the spotted wood owl (Strix seloputo baweana; Rahman et al. 2016; Rahman et al. 2017a).
According to the IUCN Red List version 2015.4 (IUCN 2015), deer are one of the most threatened mammal groups (http://www.iucnredlist.org/about/summary-statistics). Of the 53 deer species living in tropical regions, 12 are ‘endangered’, one is ‘critically endangered, and one is extinct (IUCN 2017). The critically endangered (cr) deer species is the Bawean deer (Semiadi et al. 2015), which is listed in Appendix I of CITES (CITES 2020), and is one of the 25 priority species legally protected by the Indonesian government (Ministry of Environment and Forestry 2015).
However, the Bawean deer has been little studied in the wild, mainly due to its low densities, remote habitat, and secretive behaviour (Semiadi et al. 2015; Rahman et al. 2017a). Population trends, ecology, and conservation of the Bawean deer have been reported previously based on limited data (Semiadi et al. 2015; Rahman et al. 2017a; Rode-Margono et al. 2020). However, this information collected during the past decade can be used as a baseline for improving our knowledge of the abundance, distribution, and conservation status of the Bawean deer (Rahman et al. 2017a; Rahman et al. 2017b), and their prospects for conservation in the country.
Here, we analyze 24 months of intensive camera trapping data to (1) update population estimates and infer population trends, (2) assess seasonal, habitat, and environmental factors influencing recording rates, (3) examine activity patterns, social structure, and reproductive patterns, and (4) provide information on potential threats caused by free-roaming dogs.
Materials and methods
Study area. The Bawean Island is part of the East Java province (Indonesia) and encompasses a total area of 200 km2 (5° 40', - 5° 50' S and 112° 3', - 112° 36' E). The precipitation drives the seasonal climate with the greatest rainfalls occurring between the end of October and April (wet season). The average annual rainfall is approximately 2,500 mm (data from the meteorological station of Sangkapura sub-district). The study area includes the Bawean Island Nature Reserve and Wildlife Sanctuary (Figure 1), which are characterized by steep topography (with slopes > 60°) and a wide altitudinal gradient (0 to 630 m). The protected areas are divided into five wildlife reserves (38 km2), six nature reserves (7 km2), and three community wildlife reserves (1.6 km2). The island landscape is dominated by a mosaic of tall forests (characterized by Ficus variegata, F. septica, Podocarpus rumphii, and multiple Eugenia species, interspersed with dense patches of small trees) on the steep slopes and tops of the higher mountains, pastures, teak forests, community forests, shrublands, human settlements, crops, and fishponds in the lower areas (Nijman 2006; Rahman et al. 2017a). The protected areas are dominated by tall forest (primary or mature secondary forest), teak forest (monoculture of Tectone grandis stands with undergrowth dominated by grasses and sparse herbaceous plant and shrub cover), community forest (mixture of cultivated trees such as Spondias pinnata, Artocarpus heterophyllus, Tectona grandis, Tamarindus indica, Bambussa spp., Arenga pinnata and undergrowth dominated by either shrubs or grasses) and shrubland and degraded forest (patches of dense young trees with clear signs of logging and burning, and undergrowth either dominated by grassland and herbaceous plants, or dense shrub cover; Nijman 2006).
Data collection. From November 2017 to October 2019, we conducted continuous camera trapping using 30 camera-traps Bushnell Trophy Cam (Model 119877C and HD Max 119576C). Each camera trap was installed in the centre of a regular hexagon grid cell of 1 km by 1 km according to local topography and site accessibility. These cameras were rotated to cover a total of 110 grid cells over two years (Figure 1). Cameras were positioned at 30 - 50 cm above the ground and set to capture both small and large animals throughout the 24 - hour/day, recording sixty-second videos at each trigger, with a 15 seconds resting lapse (Rahman et al. 2017a). Records of the same species taken within a 1-hour interval were not considered as independent events (Rovero and Marshall 2009). No camera trap was baited and all videos were stamped with the date and time. Camera traps were visited every 3 - 4 weeks for maintenance, replacement of memory cards or downloading of the videos.
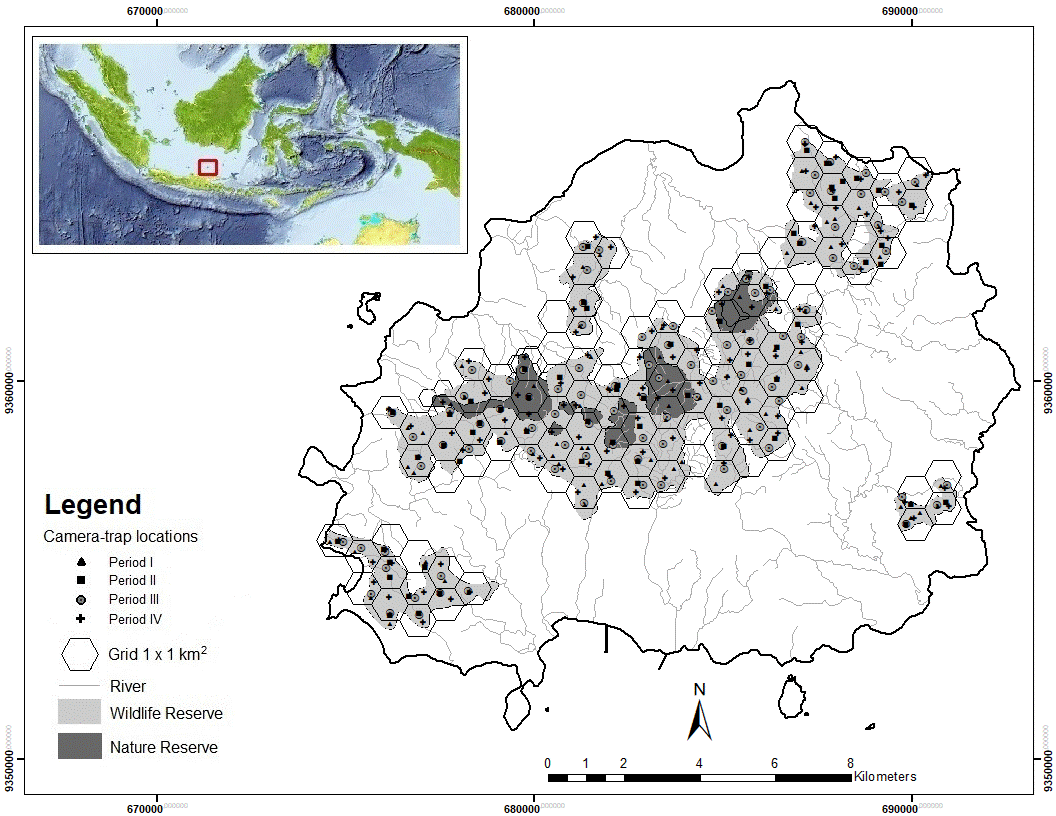
Figure 1 Camera trap sampling locations in the Bawean Island Nature Reserve and Wildlife Sanctuary, Indonesia.
The camera traps were deployed during four periods following the wet and dry seasons: at 76 stations from November 2017 to April 2018 (wet season 1), at 63 stations from May to October 2018 (dry season 1), at 100 stations from November 2018 to April 2019 (wet season 2), and 100 stations from May to October 2019 (dry season 2). Data were managed using CamtrapR software (Niedballa et al. 2016). The date and time of all videos were extracted automatically, and the geographical coordinates and habitat type of camera trap installation in the field were converted into digital data in GIS using the ArcMap program.
Data analysis. A Chi-squared test was applied to compare the numbers of independent trapping events among seasons. Moreover, we calculated trapping rates (TR) as the ratio between the number of independent trapping events and the sampling effort (measured as the number of days when cameras were active), multiplied by 100 (O'Brien et al. 2003). As the number of photographs significantly differed between seasons by Chi-square tests, then we compared the seasonal trapping rate among habitat types in each study site using Kruskal-Wallis tests adjusted for equal numbers and post hoc tests for multiple comparisons (α = 0.05).
The Bawean deer is a species that cannot be individually identified based on their natural marks therefore, we estimated its density applying the Random Encounter Model (REM; Rowcliffe et al. 2008). This method assumes that the population is closed, meaning that there are no births, deaths, immigration, or emigration during the period of estimation (Rowcliffe et al. 2008). To fulfill this assumption, the absolute population numbers were calculated for trapping lengths of 60 to 90 days (Rahman et al. 2017a; Harmsen et al. 2020). We used the following equation to obtain density estimates from camera trap encounter rates (Rowcliffe et al. 2008): gD= Y/t π/(2+ ϴ )rv . Where y/t = trapping rate, θ = angle of detection, r = distance at detection for each camera trap, and v = animal speed movement recorded from videos (Rowcliffe et al. 2011). The outcome can then be multiplied by g (mean group size), as the independent unit recorded by the camera is the group rather than the individual (Rowcliffe et al. 2008; Zero et al. 2013). We assumed these parameter values to be valid throughout the trapping period. The REM used in this study follows Rowcliffe et al. (2008); Rowcliffe et al. (2011), and Rowcliffe et al. (2014), and is described in detail in Rahman et al. (2017a). Lastly, the estimated density per km2 was extrapolated to the total size of the Bawean Island protected area to provide an estimate of the population. The error propagation approach by Ku (1966) and Taylor (1997) was used to assess the uncertainty effect of parameter variables on the uncertainty of the density function. As only mature individuals contribute to reproduction, the population size for conservation purposes was corrected by the proportion of adults in groups.
Occupancy models were used to analyze the proportion of area occupied by the Bawean deer. These models were developed considering that the detection/non-detection of species and the environmental conditions may have an influence on the probability of species occupying the area (MacKenzie et al. 2006). Fifteen covariates of habitat were used to model the occupancy probability of the Bawean deer. These were distances to the nearest: tall forest edge, community forest, teak forest, shrubland, degraded forest, crop field area, human settlement, protected area border (roughly coinciding with the forest border), water resource, and road (for definitions see Rahman et al. 2017a). All distances were calculated in ArcGIS Desktop (Version 10.5.1; Environmental Systems Research Institute, Inc., Redlands, CA). Vegetation productivity was measured as the normalized difference vegetation index (NDVI, cf. Hansen et al. 2009). Minimum and maximum daily temperatures and precipitation data were obtained from Sangkapura meteorological station. Lunar illumination was retrieved from the moon calendar (Thomas 1998). We tested the covariates for multicollinearity using Pearson’s correlation matrix (STATS package R 3.1.1). We did not include covariates with a correlation > 0.5 in the same candidate model. We grouped camera-trapping data in sampling intervals of seven consecutive days (26 occasions per season; MacKenzie et al. 2006).
The outcomes of multi-season occupancy modelling are reported using the R package unmarked (Fiske and Chandler 2011) to evaluate the effect of habitat variables on the proportion of area occupied by the Bawean deer. Incomplete records due to missing covariate values were removed from the model. Models assessed the impact of all previously described site and observation-level covariates on the probability of occupancy, as well as the impact on the probability of detection (MacKenzie et al. 2002, 2006; Rahman et al. 2019; Rode-Margono et al. 2020). All models with a ΔAICc value < 2 were competitive (see Rahman et al. 2019 for details).
Hereinafter, descriptive statistics were used for analysing behaviour, group size, and group pattern. The R package Activity (Rowcliffe et al. 2014) and Oriana circular statistics software (v4, Kovach Computing Services, Anglesey, UK) respectively, were used to estimate the proportion of time spent active and daily activity patterns. Statistical differences among activity levels estimates at sunrise (dawn), sunset (dusk), noon and midnight, were computed with the Wald test. Next, the Chi-square test was used to compare the frequency of observations between day and night, and between sunrise and sunset, whose timing was obtained from the Astronomical Applications Department of the US Naval Observatory.
We used the same camera trap sampling for estimating the daily activity pattern overlap between Bawean deer and free-roaming dogs by applying the statistical methodology developed by Ridout and Linkie (2009), using R version 4.0.2 (R Development Core Team 2020). We used the estimator for the coefficient of overlap as recommended for medium-large sample sizes (Ridout and Linkie 2009). We defined overlap < 0.5 as low, 0.5 - 0.75 as moderate and > 0.75 as high (Monterroso et al. 2014). Due to the overdispersion of data, we used two scales to describe the spatial overlap between species. These were the number of independent contacts per hour per habitat type (correlation type 1: spatial overlap between the two species over the whole study period) and the number of independent contacts per location-month (correlation type 2: spatial overlap for each calendar month). Differences between correlation types 1 and 2 indicated the level of attraction (positive value) or avoidance (negative value) in each calendar month. Based on the results of correlation type 1 and 2, we tested daily activity rhythm in the tall forest using binomial General Linear Models (GLM). Furthermore, we computed Chi-square tests to compare daily and monthly activity and habitat use between species (Batschelet 1981). Lastly, trapping rates from each camera trap (Carbone et al. 2001) were used to investigate the spatial overlap between Bawean deer and free-roaming dogs. Trapping rate is a relative index of animal’s spatial use and a crude abundance estimate (Carbone et al. 2001). We treated each camera trap as an independent spatial point. At each camera trap, the observed TR was correlated between Bawean deer and free-roaming dogs using Spearman’s rank correlation coefficient, and spatial overlap between species pairs was assessed using a Pianka index.
Results
Trapping rate and population size. In total, we accumulated 29,350 camera-trap days and 353 independent contacts of Bawean deer. The trapping rate was significantly different between wet and dry seasons, with a lower number of contacts in the wet season than in the dry season (TR wet = 1.03, TR dry = 4.83; χ2 = 14.54, df = 1, p < 0.05). Trapping rate differed among habitat types in both seasons: dry H = 28.16, df = 3, p < 0.001; wet H = 19.28, df = 3, p < 0.001.
Random encounter modelling based on the four trapping periods yielded variable population estimates for the Bawean deer, ranging from a minimum of 142 individuals in the second wet period to a maximum of 647 in the second dry period (Table 1). Bawean deer were recorded in small family groups (with or without males), pairs, and as single males (Table 2). Fawns and juveniles occurred mainly from March to November. Changes in group structure over the year indicate a reproductive peak in the dry season, particularly in July (Figure 2). Our overall mean estimate across the entire study period was 143-345 mature individuals.
Table 1 Camera trapping parameters, adjustment factors, Random Encounter Model output and estimated population size and number of mature individuals of Bawean deer during four camera-trap survey lenghts meeting the assumption of a closed population.
| Parameters | Survey length | |||
|---|---|---|---|---|
| I (15 Feb.-30 Apr. 2018) | II (4 Jul.-3 Oct. 2018) | III (1 Nov. 2018-9 Jan. 2019) | IV (20 Jun.-12 Oct. 2019) | |
| Truncated operation length (days) | 13 | 5 | 10 | 21 |
| Number of camera traps | 30 | 24 | 28 | 28 |
| Parameter estimates | ||||
| Trapping rate | 0.032 | 0.080 | 0.030 | 0.080 |
| Day range (km/day) | 1.625 | 2.654 | 1.448 | 2.772 |
| Radial distance (km) | 0.008 | 0.008 | 0.008 | 0.008 |
| Angle (radians) | 0.327 | 0.327 | 0.327 | 0.327 |
| Adjusment factors | ||||
| Mean group size | 1.780 | 1.240 | 1.662 | 1.250 |
| Proportion matures | 0.556 | 0.702 | 0.512 | 0.714 |
| Model output | ||||
| Density (individual/km2) | 3.85-7.59 | 4.54-9.23 | 3.04-8.88 | 6.86-13.88 |
| Adjusted model output | ||||
| Estimated population size | 180-354 | 212-430 | 142-414 | 320-647 |
| Estimated number of mature individuals | 100-197 | 149-302 | 73-212 | 228-462 |
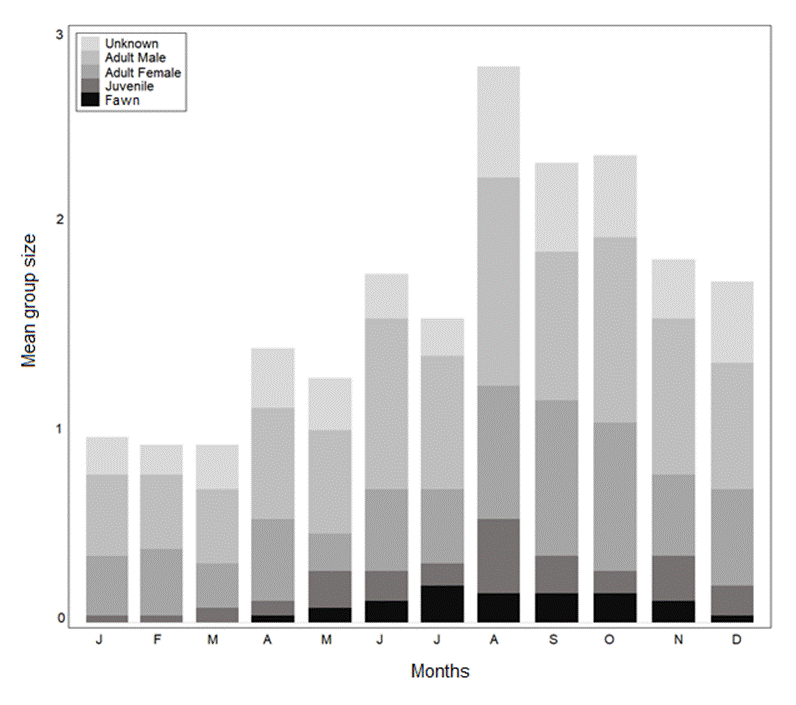
Figure 2 Monthly patterns of group size and structure of Bawean deer based on camera-trap records (n = 267) in the Bawean Island Nature Reserve and Wildlife Sanctuary, Indonesia.
Patch occupancy. Of the 110 camera-trap stations placed in both seasons, Bawean deer were detected at 26 in the wet season and 34 in the dry season. The maximum area occupied by Bawean deer was then 11 km2 and 14.4 km2 out of 46.6 km2 total surveyed area in wet and dry seasons respectively (Figure 3a). The model of ψ (settlement); p (protected area) for the wet season and ψ (settlement); p (.) for the dry season were the most parsimonious (Table 3). The occurrence of Bawean deer was negatively affected by distance to the nearest human settlements in both seasons (Figure 3b). The total fraction of area for the model-averaged occupancy probability is ψ (SE[ψ]) = 0.40(0.08) with detection probability (SE [ p̂ ]) = 0.12(0.05) and ψ (SE[ψ]) = 0.45(0.08) with detection probability (SE[ p̂ ]) = 0.20(0.09), respectively in the wet and dry seasons.
The daily activity of Bawean deer and free-roaming dogs. Independent contacts of Bawean deer (n = 353) indicated an overall activity level of 0.58, but Rayleigh tests of Oriana circular statistics software did not detect significant deviation from a uniform daily activity distribution (z = 1.14, P = 0.633; Figure 4). Nevertheless, according to Wald tests, deer tended to be more active at dusk than dawn (p = 0.025) or midday (p < 0.01), with a mean activity time of 18.21 ± circular SD 8 minutes. There was no significant difference in the number of encounters between day and night (χ2 = 2.482, df = 1, p = 0.189).
We found a high degree of daily activity overlap between Bawean deer and free-roaming dogs (estimated overlap coefficients < 0.55, = 0.74; Figure 5a). Both species had non-overlapping spatial activity in four habitat types in which the activity peak was not different (Figure 5b).
Tall and community forests, as well as teak forests, were regularly used throughout the year. Whereas in the tall forest, the period of activity during the day increased from March to September and the lowest occurred from December to January (Figure 5c), coinciding with the dry and wet seasons, respectively. The trapping rates of Bawean deer and free-roaming dogs were higher in the community forest, indicating that both species intensively use the same area compared to other areas (Figure 5c). Although both species did not appear at the same time in the same areas. Bawean deer showed a bimodal pattern with equal higher activities at dawn and dusk, and free-roaming dogs displayed high activity in the afternoon and late afternoon (15:00 to 16:00). The model ignored the small activity peak at dawn due to a 95 % confidence interval (Figure 5d). Differences between spatial activities were significant for both species (daily activity: χ2 = 131.33, df = 23, p < 0.001; monthly activity: χ2 = 13.46, df = 10, p < 0.05; habitat use: χ2 = 1.58, df = 3, p < 0.05). In the context of spatial overlap between Bawean deer and free-roaming dogs, there was a positive spatial correlation between the two species (Spearman correlation = 0.28, P < 0.05; Pianka index = 49). Camera traps did not record direct encounters between Bawean deer and free-roaming dogs, but predation of Bawean deer by free-roaming dogs was witnessed at several locations (Figure 6).
Table 2 Mean group size, mean litter size and group combinations of Bawean deer recorded by camera traps from November 2017 to October 2019 in Bawean Island Nature Reserve and Wildlife Sanctuary.
| Parameters | Value |
|---|---|
| Number of videos | 353 |
| Mean group size ± SD (range, n) | 1.24 ± 0.36 (1-3) |
| Litter size ± SD (range) | 1 ± 0 (1-2) |
| Number of adult females (range) | 0.58 ± 0.51 (0-2) |
| Number of adult males (range) | 0.32 ± 0.49 (0-1) |
| Number of unknown adults (range) | 0.18 ± 0.34 (0-2) |
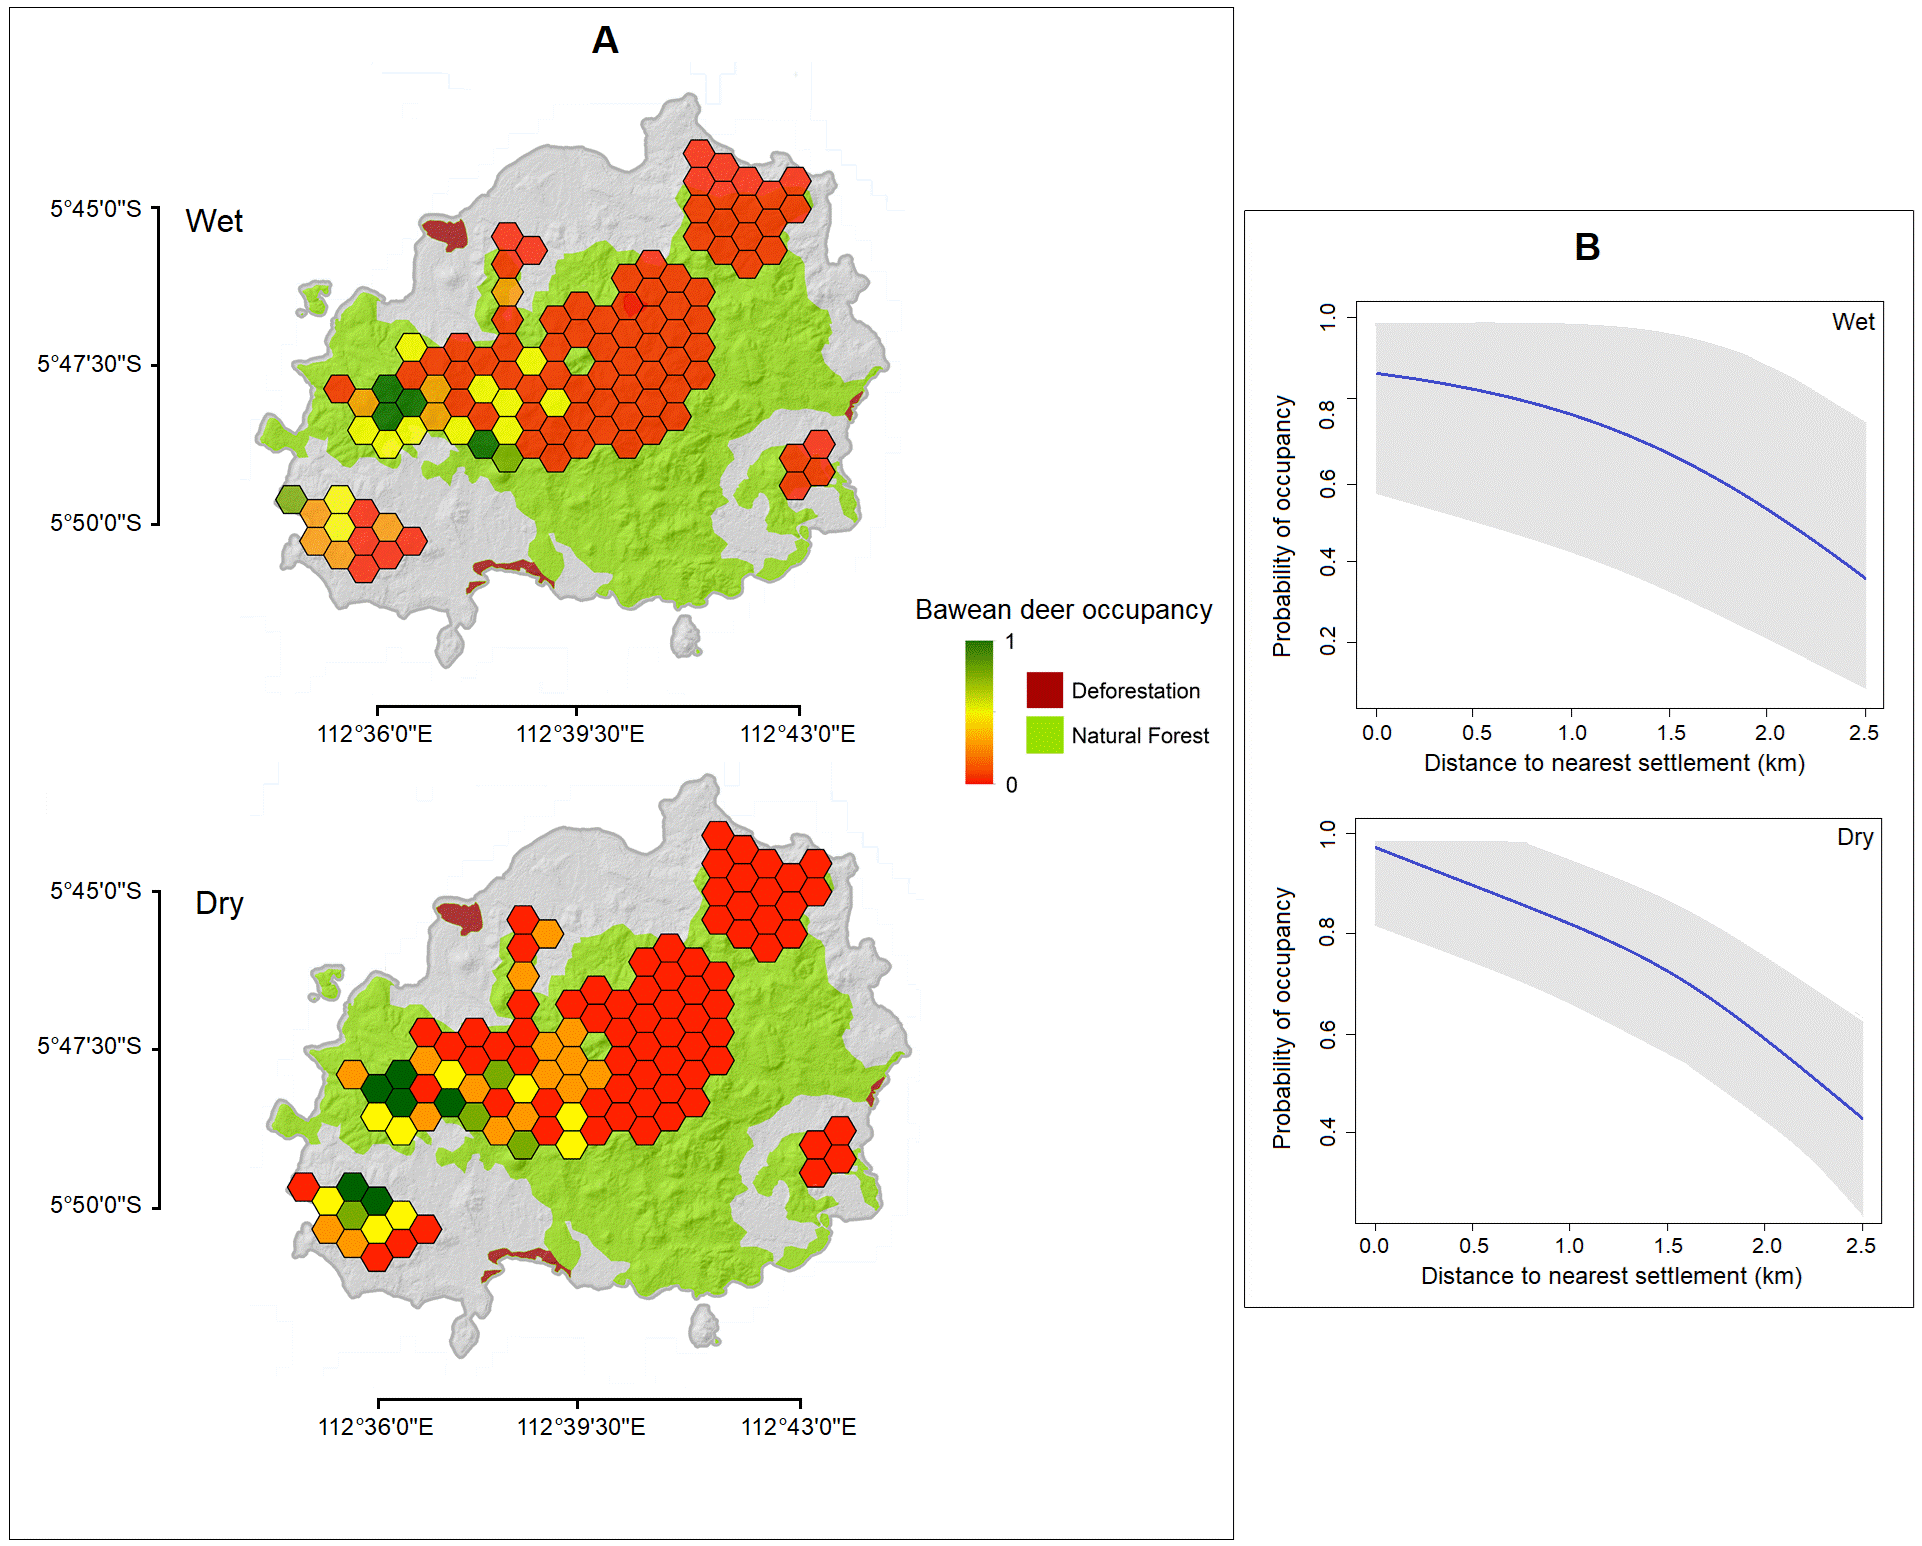
Figure 3 (a) Map showing the posterior mean of occupancy probability (ψ) of Bawean deer in wet and dry seasons for each tile of Bawean Island Nature Reserve and Wildlife Sanctuary, Indonesia, and (b) Predicted occupancy and detectability of Bawean deer, in relation to the distance to the nearest human settlement and protected area, respectively.
Discussion
Our study provides a robust estimate of Bawean deer density from a large, long-term photographic capture dataset. This monitoring increased detection numbers and improved parameter estimates from previous research by Rahman et al. (2017) and Rode-Margono et al. (2020), for the most elusive groups within the Bawean deer population. This scope allowed us to address concerns of many previous Bawean deer studies, including small sample sizes, low detection rate, and the limited spatial and temporal extent to provide a complete description of the Bawean deer population in our study area (Rode-Margono et al. 2020). Moreover, our approach to spatial and temporal study design may offer useful guidance for future studies of deer and other medium-sized herbivores.
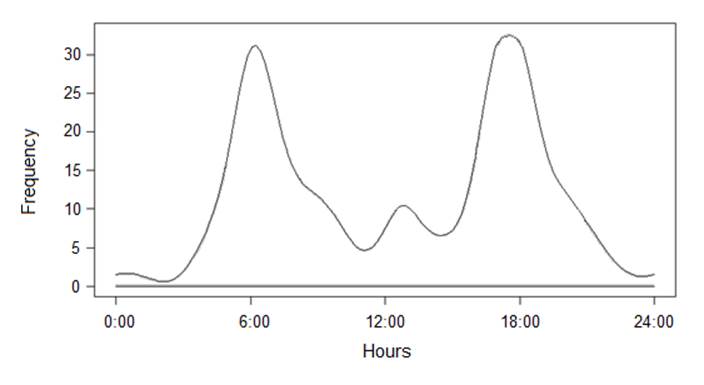
Figure 4 Activity plots of Bawean deer in the Bawean Island Nature Reserve and Wildlife Sanctuary, Indonesia, based on camera-trap records (n = 267).
Density estimates. Our estimates of Bawean deer density are 7.6 Bawean deer/km2 (including fawns) or 4.4 adults/km2. Similar density estimates have been reported by Rahman et al. (2017a), and Rode-Margono et al. (2020). They suggest that the Bawean deer population declined from the first survey by Blouch and Atmosoedirdjo (1978) from approximately 400 deer to only 277. This low Bawean deer density most likely results from predation by free-roaming dogs (Rahman et al. 2016; Rahman et al. 2017a; Rode-Margono et al. 2019), but also retaliatory killing incidents following crop field damage, and low forage productivity because of the massive spread of wild pigs (Sus verrucosus blouchi) and alien plant species (Blouch and Atmosoedirdjo 1978; Rahman et al. 2016; Rahman et al. 2017a; Murbani 2018; Rode-Margono et al. 2019). Reports indicate that during the past five years’ wild pig invasion of local crops has been a major concern for local farmers who requested population control from the local authorities (Semiadi, unpubl data; Nursyamsi pers. comm.).
The rapidly increasing population of wild pigs causes several problems for landowners and livestock, as well as the environment itself (Gürtler et al. 2017). In many developing countries, local people in surrounding forests have often endured costly disturbance from wild animals (e.g., wild pigs) in their crop fields causing human-wildlife conflicts (Pandey et al. 2016).
Killing pest animals has often led to the accidental killing of other species (Loveridge et al. 2017; Rahman et al. 2020), hence it is important to investigate the interactions with wild pigs. Although there is no evidence and comprehensive research related to competition between the two species, the diet of wild pigs and the native Bawean deer likely overlap and wild pigs might have a competitive advantage over deer due to their omnivorous diet and aggressive behaviour. Furthermore, on Bawean Island, at least seven invasive alien plant species have been identified i.e., Ageratum conyzoides, Chromolaena odorata, Eupatorium inulifolium, Lantana camara, Imperata cylindrica, Stachytarpheta jamaicensis and Themeda arguens (Trimanto et al. 2016). The invasion of Chromolaena odorata and regrowth of Tectona grandis stumps reportedly altered the natural habitat quality of Bawean deer and contributed to the population decrease of Bawean deer (Semiadi et al. 2015).
Table 3 Multi-season occupancy model selection for identifying the main relevant variables of the Bawean deer habitat; roles of covariates in determining probability of occupancy by deer estimated by camera trapping between November 2018 and October 2019, grouped in sampling intervals of 7 consecutive days.
| Model | Number of parameters | AICc | ΔAICc | AICw | Cumulative Weight | Model Likelihood | Cond Psi total average by area |
|---|---|---|---|---|---|---|---|
| Wet season | |||||||
| Ψ (Settlement); p (Protected Area) | 4 | 121.15 | 0.00 | 0.40 | 0.40 | 1.00 | 0.528 |
| Ψ (Secondary); p (.) | 3 | 124.84 | 3.69 | 0.30 | 0.70 | 0.34 | 0.548 |
| Ψ (Secondary + Cultivated); p (.) | 4 | 125.23 | 4.08 | 0.12 | 0.82 | 0.25 | 0.462 |
| Ψ (Primary + NDVI); p (.) | 4 | 127.69 | 6.54 | 0.10 | 0.92 | 0.20 | 0.442 |
| Ψ (River + Elevation); p (.) | 4 | 128.13 | 6.98 | 0.08 | 1.00 | 0.19 | 0.528 |
| Dry season | |||||||
| Ψ (Settlement); p (.) | 3 | 115.33 | 0.00 | 0.58 | 0.58 | 1.00 | 0.106 |
| Ψ (Settlemen + Cultivated); p (Protected Area) | 5 | 117.17 | 1.84 | 0.18 | 0.76 | 0.35 | 0.246 |
| Ψ (Settlemen + Cultivated); p (Secondary) | 5 | 118.36 | 3.03 | 0.10 | 0.86 | 0.22 | 0.250 |
| Ψ (Settlement); p (NDVI) | 4 | 119.31 | 3.98 | 0.10 | 0.96 | 0.20 | 0.069 |
| Ψ (River); p (.) | 3 | 122.03 | 6.70 | 0.04 | 1.00 | 0.20 | 0.043 |
Density estimates indicate the existence of a seasonal pattern with the highest values in the dry season. This relates to seasonal changes in spatial activity patterns of Bawean deer in response to resource availability, as suggested by Rahman et al. (2017b). These results confirm the variations previously recorded by Rahman et al. (2017a) and Rode-Margono et al. (2020). Seasonal spatial activity patterns are an important issue for subsequent density estimates aimed at revising the conservation status of the species.
Landscape occupancy. Bawean deer occupancy is negatively correlated with distance to the nearest settlement but not with other covariates. Similarly, Rahman et al. (2017b) found a negative correlation between camera-trap rate and distance to settlements, together with a preference for tall and community forests near forest edges but not in the inner forest, which is presumably a primary forest. We also recorded a small number of deer in the interior of protected areas. This pattern may be attributable to the existence of a lower diversity of food plant species there than within forest edges (Wirth et al. 2008), and to the secretive behaviour of Bawean deer that is difficult to survey in dense habitats (Rahman et al. 2016). However, the reasons for a lower abundance or absence in the inner protected area should be further investigated for improving habitat quality as a conservation measure. Moreover, Bawean deer have previously been found also in semi-open cultivated habitats (Semiadi 2004), and this may have been captured in our data by the high probability of occupancy at forest edges. From a conservation perspective, this habitat preference is risky for Bawean deer, as crops are also damaged by wild pigs instigating non-specific hunting methods (e. g. snares), which should only be designated for pest animals (BBKSDA East Java 2009). For example, in 2018, deer deaths were caused by snares in a community forest in the Western Sareden Pudakit area (Mt. Besar).
Our data confirm the importance of protected areas for Bawean deer conservation. As such, they may be a source of dispersing individuals, supporting the persistence of Bawean deer populations in the surrounding areas. Bawean deer distribution on Bawean Island is restricted to extensive low tropical and hill forests remaining, at altitudes between 34 and 320 masl. The areas with verified Bawean deer presence are Gunung Besar and Kumalasa Blocks. High rates of deforestation and habitat fragmentation on Bawean Island have restricted current Bawean deer distribution to mostly protected and/or remote areas on the island. Protected areas and other refuges play a crucial role in maintaining other medium-large herbivore populations in landscapes with large human impacts (Rahman et al. 2020; Western et al. 2009; Meyer et al. 2016).
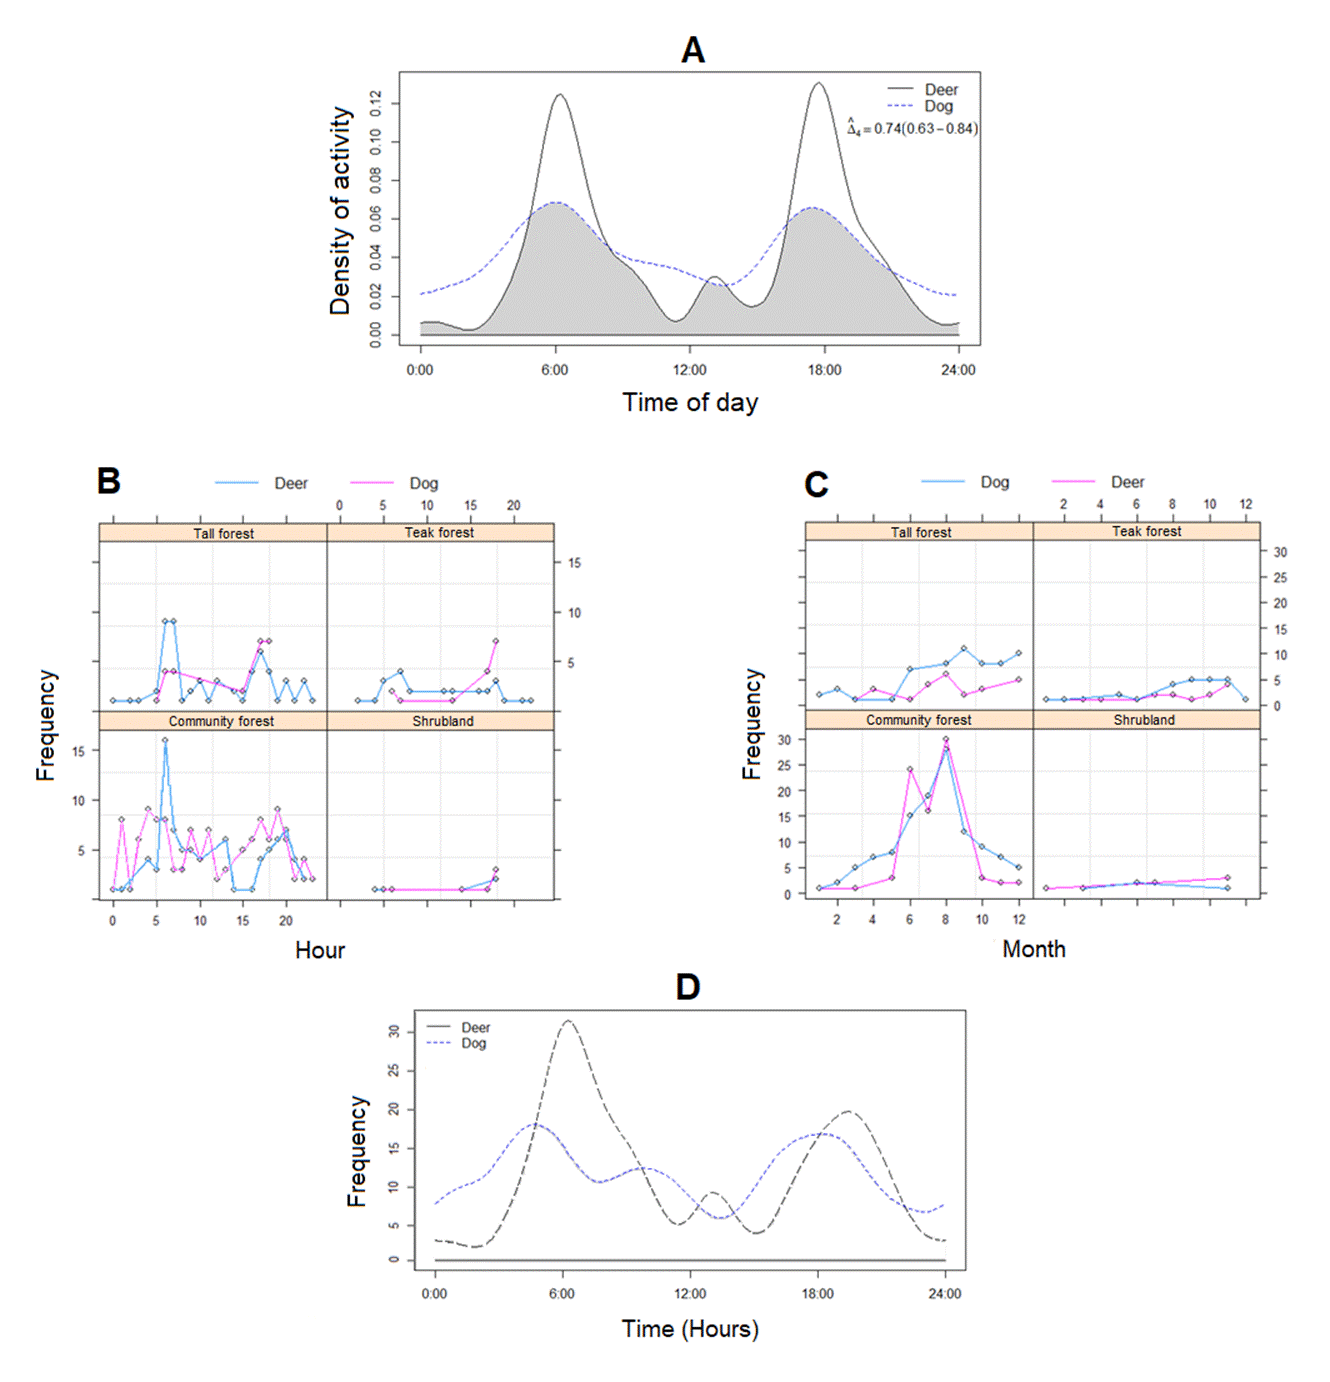
Figure 5 Bawean deer and free-roaming dogs in the Bawean Island Nature Reserve and Wildlife Sanctuary, Indonesia, (a) The degree of daily activity pattern overlap, (b) The difference between the number of independent contacts per hour per habitat and (c) per month per habitat, and (d) The level of daily activity rhythm in the tall forest.
Daily activity, group sizes, and group patterns. Bawean deer showed a similar activity pattern to those reported in other studies (Rode-Margono et al. 2020), tending to be crepuscular, with significant day-time activity and some at night. In contrast, Semiadi et al. (2015) in their study showed that Bawean deer are primarily nocturnal, active intermittently through the night. The differences may be attributable to various factors. Firstly, previous monitoring of Bawean deer relied solely on the eyes of observers. The ability to collect data on rare or secretive species that are generally difficult to observe directly can lead to significant improvements in understanding the ecological community (Azlan et al. 2006). Secondly, hunting has led to high population declines of Bawean deer in the past (Rahman et al. 2017b). The activity pattern of ungulates is strongly related to their predators (Prugh et al. 2019). With the absence of natural predators and lower hunting activity by humans in the past five years, we surmised whether Bawean deers might be adapted to a more flexible or changing pattern in their behaviour in response to those pressures. The closely related hog deer increased nocturnal activity (Dhungel and O’Gara 1991) as have other deer species (Ikeda et al. 2019), because of high hunting activity. Behaviour change provides a window into the animal world that can explain what animals do when they are stressed or threatened and what they prefer and dislike.
The sex ratio was skewed to females (2:1). However, in most studies, more males are recorded than females because males tend to move more and have more extensive home ranges. The camera traps recorded only single adults, pairs, or mothers with infants. This group composition is similar to previous reports (Blouch and Atmosoedirdjo 1978; Semiadi et al. 2015; Rode-Margono et al. 2020). Our mean group size of 1.24 (range 1-3) is similar to the closely related hog deer, which is reportedly 1.81 ± 0.11 (Sinha et al. 2019). Moreover, the reproductive peak in Bawean deer occurs in the middle of the dry season, with no immature individuals observed during the peak of the wet season.
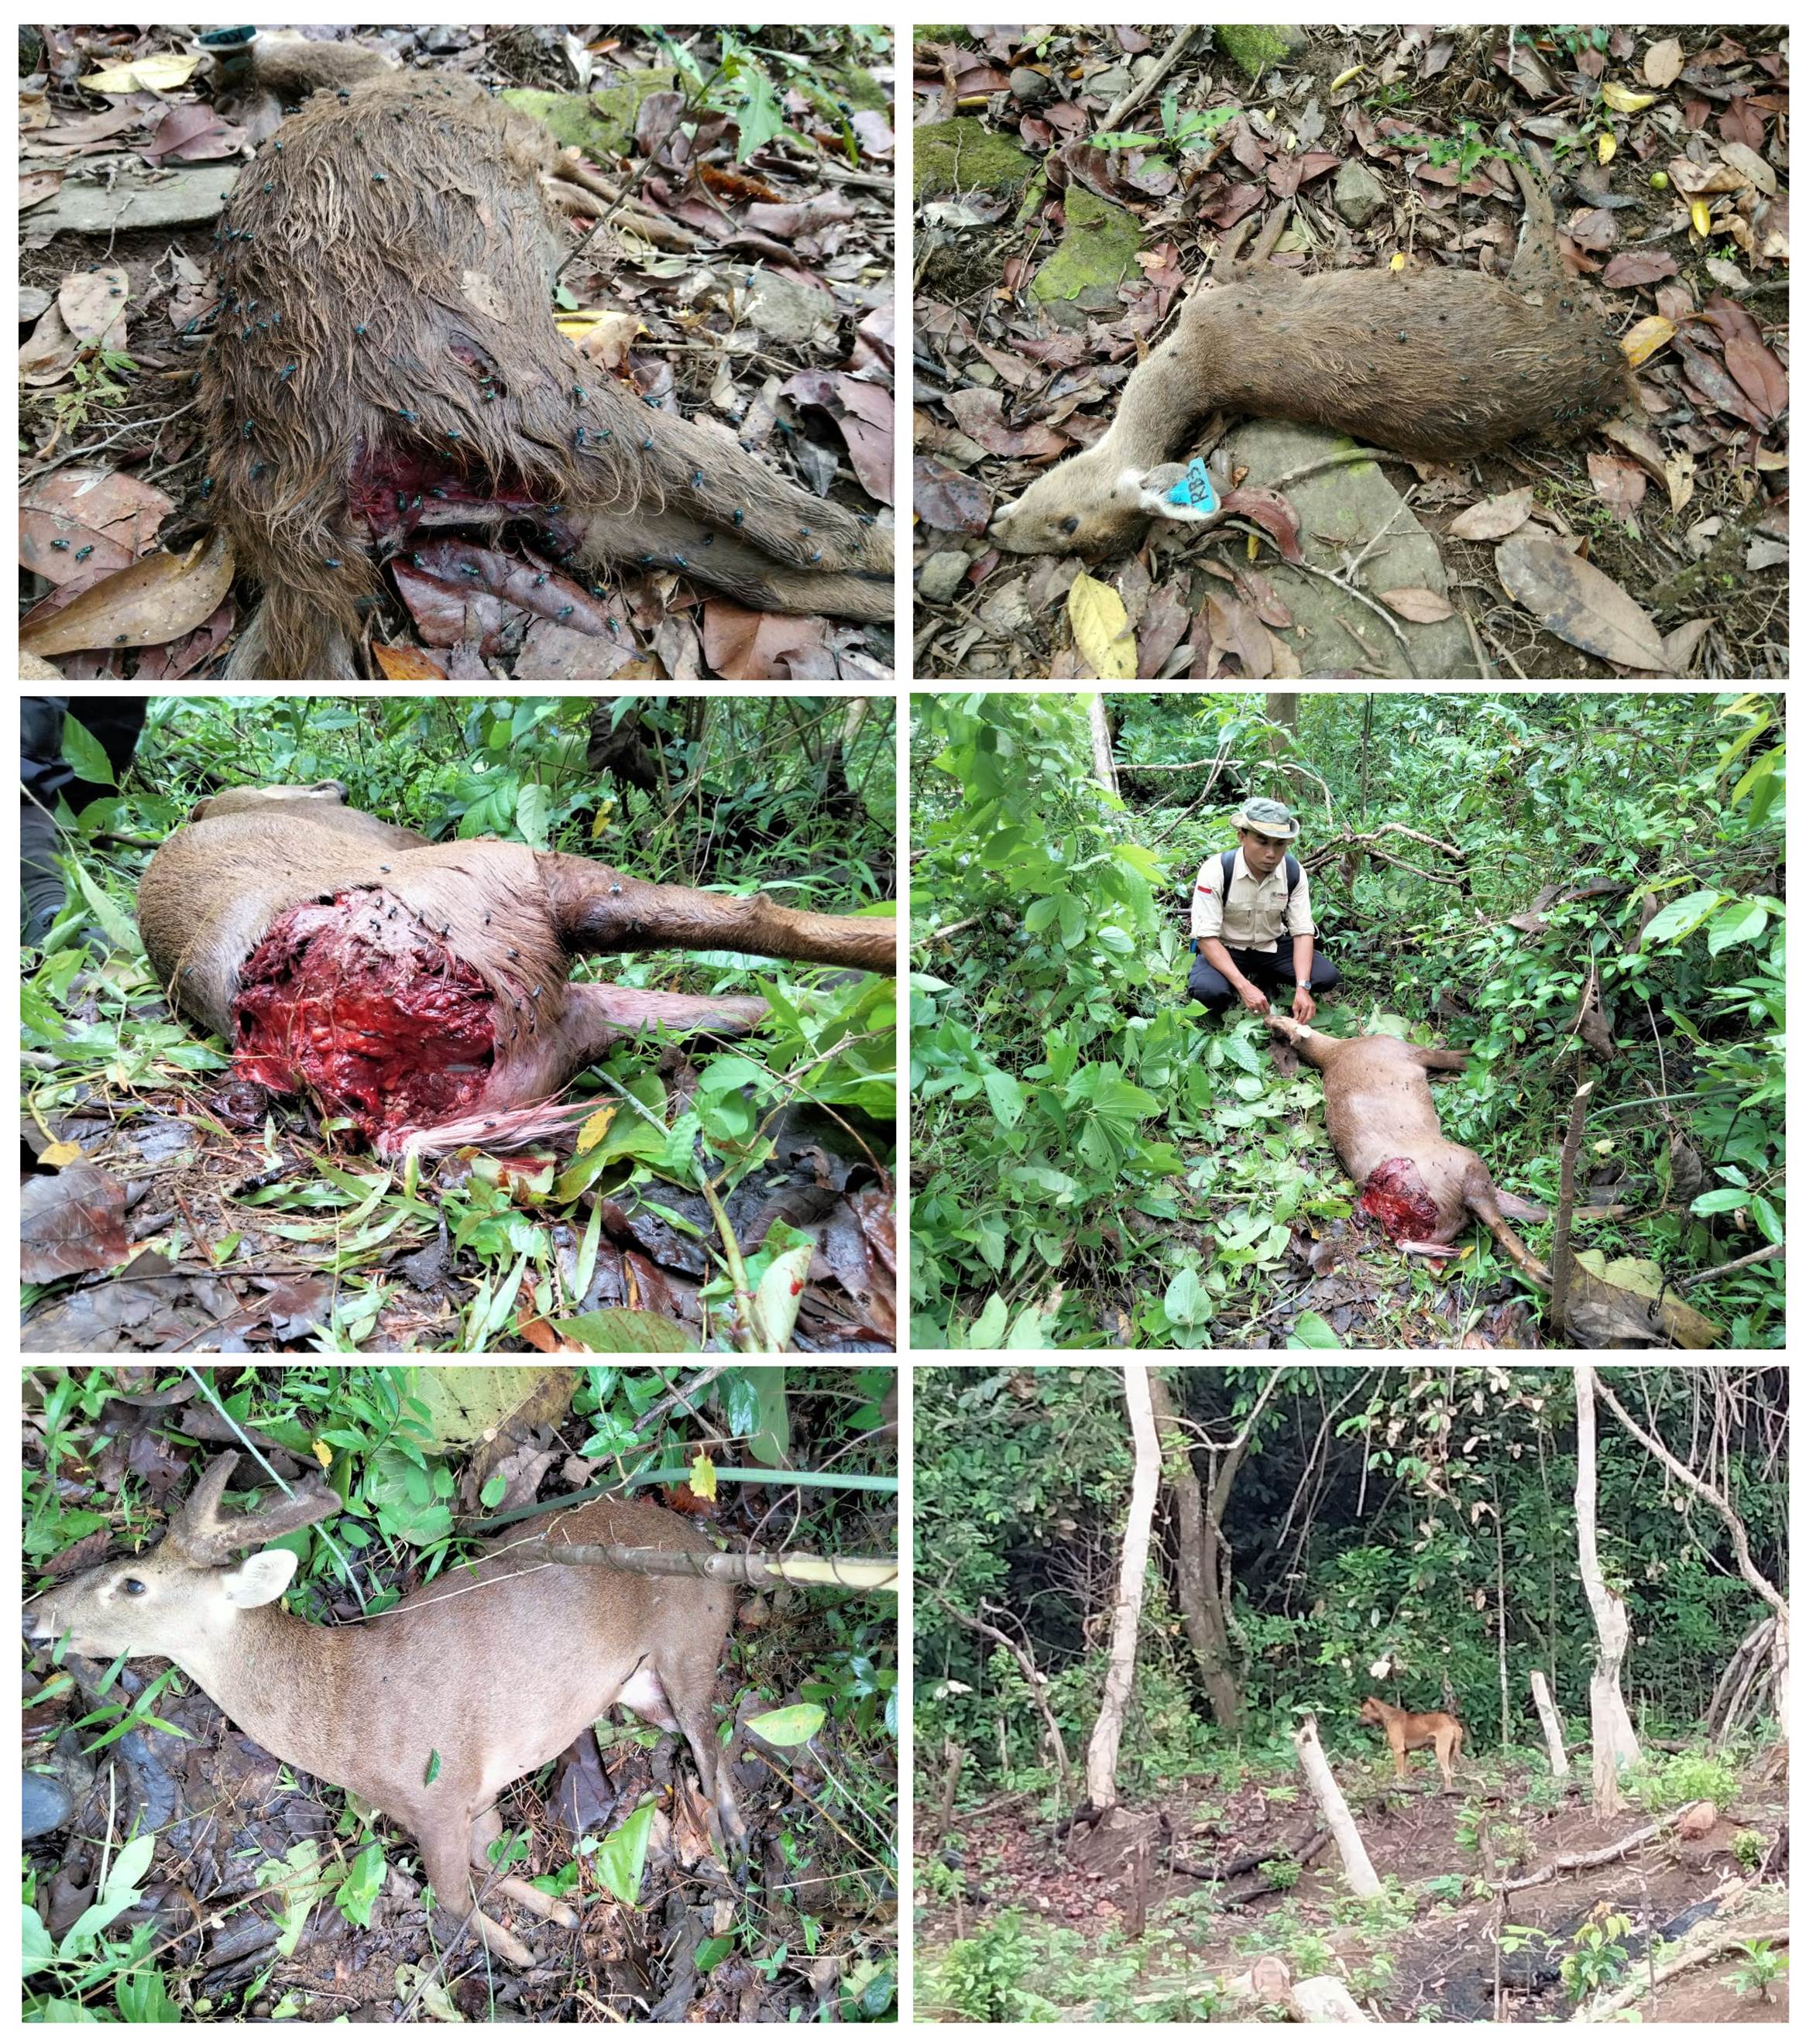
Figure 6 Bawean deer freshly killed and partially eaten by free-roaming dogs in Bawean Island, Indonesia, from 2014 to 2020 (Source: D.A. Rahman, Nursyamsi).
Potential threat by free-roaming dogs. This study presents the first results on the activity patterns of both Bawean deer and their potential predators, free-roaming dogs. We report a similar daily activity and use of habitat supporting a temporal and spatial niche overlap which may induce negative effects on the Bawean deer population. The presence of free-roaming dogs can reduce the amount of time spent in foraging activities by Bawean deer and could increase intraspecific competition for space. In the past, dogs were used by local people for hunting activities (Murbani 2018), forcing Bawean deer to increase their activity by night, and to find refuges far from roads and human settlements during the day (Rahman et al. 2017b).
We are aware of two Bawean deer killed by dogs in 2014; one female died in the Durin River in 2015; one female from the Mt. Besar Block and one male from the Kumalasa Block were chased by dogs to the residential area in 2016. Two females released near their captive breeding site were killed by dogs in 2017 and one male from Mt. Dedawang in 2020 (Figure 6). Sometimes Bawean deer manage to escape chasing dogs, for example in Mt. Maninjo (Suwari Village) in 2019 and Mt. Gadung (Mt. Besar Block, East Pudakit Village) in 2020. On a larger scale it is well known that the increase of free-roaming dogs, particularly next to protected areas, can generate short-term displacement or extirpation of wild mammal species (Zapata-Ríos and Branch 2016; Doherty et al. 2017).
Conservation issues. From the 2015 IUCN assessment (Semiadi et al. 2015) and the latest study using camera trapping in 2014 (Rahman et al. 2017a), our results suggest a significant decline in the area of occupancy and habitat quality. The seasonal population sizes are well below the threshold, including the decline of mature individuals, and the area of occupancy and/or quality habitat is both small and in decline. Therefore, according to IUCN guidelines (IUCN 2012), we suggest the Bawean deer be listed as Critically Endangered following criterion B1a,b (ii,iii,v).
Our data confirm the importance of protected areas for Bawean deer conservation. As such, they may be a source of dispersing individuals, supporting the persistence of Bawean deer populations in the surrounding areas. Protected areas and other refuges play a crucial role in maintaining other medium-sized herbivore populations in landscapes with large human impacts (Western et al. 2009; Meyer et al. 2016; Rahman et al. 2020). The high extent of deforestation and habitat fragmentation on Bawean Island have restricted Bawean deer range to the most protected and/or remote areas on the island. According to the most recent data this range mainly includes low tropical and hill forests between 34 and 320 m asl. of Gunung Besar and Kumalasa Blocks.
Isolation in a small range and population decline continue to be major concerns for Bawean deer conservation (Rahman et al. 2017a, Rahman and Mardiastuti 2021). Conserving wide-ranging medium-sized ungulates relies on the protection of population sources and dispersal opportunities from sink populations through connected habitat (Pan et al. 2014). Consequently, effective habitat protection is one of the essential actions to improve Bawean deer survival. Moreover, connectivity among forest fragments sheltering Bawean deer should be improved by establishing more community reserves and implementing sustainable land-use practices either as forest management, crop and livestock production where farming has already been established in the community forest. Improving connectivity is a key strategy for the survival of the species and for gene flow among the population. Consequently, effective habitat protection is one of the essential actions to improve Bawean deer survival. Besides, favour mechanisms to reduce conflicts with humans and alien fauna and flora are crucial. Strong law enforcement is needed for halting destructive practices such as poaching, uncontrolled logging, and overgrazing in protected areas, and reducing the misdirected retaliatory killing associated with wild pig control in farmland, with dogs often misdirected and targetting deer. Management of the dog population, which began intensively in mid-2018 through preventing the birth of unwanted of puppies, poisoning, and regulated pig hunting, must be reinforced. The poor practices related to rearing dogs by people who live around the forest and protected areas on Bawean Island show a lack of responsible ownership and are leading to ubiquitous presence of dogs negatively affecting Bawean deer (Murbarani 2018). Community approach programs such as training related to dog-keeping practice and responsible ownership on Bawean Island are necessary to reduce the impacts of free-roaming dogs on Bawean deer, including also to ensure animal welfare and prevention of zoonotic disease through regular vaccination of dogs.


 nueva página del texto (beta)


