


![Características productivas del pasto rosado [Melinis repens (Willd.) Zizka]](/img/es/next.gif)


 nueva página del texto (beta)
 Inglés (pdf)
 Artículo en XML
 Referencias del artículo
 Enviar artículo por email
 Citado por SciELO
  Similares en
SciELO
Similares en
SciELO 
 Permalink
Introduction
The Mexican population is expected to reach 126 million in 2020, with an increase of 3.5% over the next four years (INEGI, 2021). In 2018, meat consumption was 65 kg per capita (beef, chicken, and pork), placing Mexico in sixth place worldwide (CMC, 2018; UNA, 2021). There are psychological, sensory, and market motivations (Font-i-Furnols & Guerrero, 2014) that promote meat consumption among Mexicans, such as family tradition, ease of preparation, price, education level, and income (Miranda-de la Lama et al., 2017; Ngapo et al., 2017; Tellez-Delgado et al., 2016). However, society demands production models that are more ethical towards the treatment of animals. There is growing interest in the transition from traditional systems to those with sustainable practices in the livestock food production chain. In addition, meat products have been promoted to have a seal for the incorporation of animal welfare (AW) practices. Some companies have declared that, in the coming years, they will only buy meat products from animals that live in free-range pastures (Molina, 2021). AW ensures the proper functioning of the organism (nutrition and health), monitors the emotional state (absence of negative emotions such as pain and fear), and promotes the natural behavioral patterns of the species (OIE, 2021a; OIE, 2021b).
The objectives of animal production include food safety, food quality, environmental protection, and good animal welfare. In developed countries, there is a greater concern about AW. These countries offer products with descriptive quality labels and references to the treatment of animals during rearing and slaughter (Moyano et al., 2015). Despite legal and union efforts, there are few studies in Mexico that relate the meat product to AW, which is a desirable attribute to include.
Historically, livestock production systems have maintained a strong social and cultural component in human communities. Young consumers are looking for added value in the products they consume, including the social responsibility of brands. Ringquist et al. (2016) remark that consumers want meat products that are affordable, tasty, and convenient, and include transparency factors that companies care about more than profits, such as safety, health, AW, and sustainability impacts. Production systems should seek product differentiation schemes focused on intrinsic and extrinsic attributes and animal species that contribute to the characterization of the desired product and the payment of the corresponding value (Mondragón-Ancelmo et al., 2018).
The production decisions of young veterinarians can have a positive impact on AW. It is important to promote a market with the availability of products that integrate AW practices. However, there is little information on the opinion of young veterinarians in Mexico regarding the perception of AW as an attribute to be incorporated in meat, knowledge of production units certified in Mexico with AW practices, and preference for meat consumption by animal species (Miranda-de la Lama et al., 2017). The perception of veterinary students is fundamental since they will have to apply good production and AW practices. Given this background, it is necessary to evaluate the instruments used to estimate the validity and reliability (Ventura-León & Caycho-Rodríguez, 2017). Ringquist et al. (2016) emphasized that cultural adaptation and validation are essential when dealing with questionnaires developed in other countries and languages. The present work presented a basis for the development and validation of a questionnaire that included the perception of AW as an attribute to be included in meat, in addition to the knowledge of certified production units in Mexico with AW by animal species and the opinion of veterinary and zootechnical students.
Material and Methods
Participants and procedures
A cross-sectional study was conducted using non-probability sampling directed at the entire student community of the Facultad de Medicina Veterinaria y Zootecnia (FMVZ) “Dr. Norberto Treviño Zapata” of the Universidad Autónoma de Tamaulipas (UAT), from March to April 2021. All students were invited to participate voluntarily by e-mail. All responses were confidential with informed consent.
The questionnaire, validity, and reliability
The questionnaire was constructed with Google Forms, with access through the web link (https://drive.google.com/open?id=1f5S1dNoYEmSqJnzBPBWNedrdvdgDdBqMZtzQ3_gkSuI) and QR codes from a Gmail account, based on reported studies (Kjaernes & Lavik 2007; Mazas et al., 2013).
In the first block of questions (n=9), socioeconomic information was obtained from the surveyed students: gender (Fe: female and Ma: male), desired area of interest in professional practice (AP: production and AM: medicine), parental economic dependence, number of family members, monthly family income, family expenditure for meat consumption, the person who buys meat. By counting the participating students according to their professional advancement, the training nucleus (TN) was obtained. Basic: (first to third semester); Disciplinary: (fourth to sixth semester) Professionalization: (seventh to tenth semester). The second block consisted of questions (n=20) on the perception of AW as an attribute to be incorporated in meat during the production process on a Likert-type scale (1: totally disagree; 2: partially disagree; 3: neither agree nor disagree; 4: partially agree and 5: totally agree). The third block (n=9) included questions on the perception of AW as an attribute to be included in the meat during the labeling process on a Likert-type scale (1: strongly disagree to 5: strongly agree). The fourth block (n= 9) consisted of questions on the knowledge of production units certified in Mexico with animal welfare (1: low, 2: medium, 3: high). The fifth block (n= 23) dealt with the preference for meat consumption due to the attributes or characteristics present on a Likert scale (1: totally disagree to 5: totally agree).
Content validity
The questionnaire items were evaluated by expert judgment (Escobar-Pérez & Cuervo-Martínez 2008; Mazas et al., 2013). Each expert answered nine questions related to the content of the questionnaire with a Likert scale from 1 to 5 (1: strongly agree; 2: disagree; 3: not sure; 4: agree; 5: strongly agree), as described by Marquez-Sandoval et al. (2014). Then, the content validity index was calculated, as indicated by Hernández-Nieto (2002) using the formula proposed by Pedrosa et al. (2014).
CVC = CVC i-Pei
CVCi = Validity coefficient for each reagent
Pei = error assigned to each reagent
The method of Hernández-Nieto (2002) assesses the degree of agreement between the judges for each item and requires a minimum of three (Pedrosa et al., 2014); likewise, these authors recommend maintaining the content validity coefficient (CVC) higher than 0.80, according to the proposed formula.
The validation process
Reproducibility, validity, and internal consistency was completed with the application of the peer-reviewed instrument to a pilot group (n=50). Validity was calculated as a measure of sampling adequacy with the Kaiser-Meyer-Olkin (KMO) test (Mazas et al., 2013). The KMO contrasts the partial correlations between variables and can be used to determine whether the variables have an invariant dimensional structure. The KMO statistic varies between 0 and 1. A value less than 0.5 indicates that the correlation between these variables is not sufficiently significant. Bartlett's sphericity test was performed (Mazas et al., 2013), which contrasts the null hypothesis of the correlation matrix of the variables, in which case said variables are not correlated. The analysis of internal consistency or reliability was carried out using Cronbach's α coefficient (Ledesma et al., 2002; Mazas et al., 2013), considering an index higher than 0.70 as respectable.
Data Analysis
Exploratory factor analysis was used to describe the total sample variation by reducing the original data set dimension, minimizing the loss of information by transforming a set of correlated response variables into a new set of uncorrelated variables (Herrera-Haro & García-Artiaga, 2019). The obtained responses in Google Forms were downloaded to a database (csv) and saved as an Excel spreadsheet, xlsx, Microsoft package, version 2016. SPSS v.25 statistical software was used for data analysis, and significance was declared with a p-value < 0.05. In the descriptive analysis, quantitative variables were expressed as mean (standard deviation) and the t-test was used to assess differences between these variables. Qualitative variables were expressed as frequencies (percentages).
Results
The questionnaire was classified from good to excellent, with a score of 0.85 in the expert judgment (Table 1). Similarly, the average score of 38.5 (out of 45 possible points, n= 4) was obtained according to the methodology of Marquez-Sandoval et al. (2014). By transforming the score of 45 to 100% and obtaining the corresponding index of the total score, an index of 0.85 was calculated.
Table 1 Determination of the logical and content validity of the questionnaire.
| I ¥ | II¥ | III¥ | IV¥ | Sx1 | MX | CVCi | Pei | CVC | |
|---|---|---|---|---|---|---|---|---|---|
| Score | 42 | 37 | 45 | 30 | 154 | 3.42 | 0.86 | 0.004 | 0.85 |
I¥: Expert 1; II¥: Expert 2; III¥: Expert 3; IV¥: Expert 4; Sx1: sum of the judges' scores; Mx: the mean of the item in the score given by the experts; CVCi: Coefficient of content validity of the item; Pei: error assigned to each item; CVC: Coefficient of content validity.
The results showed that the overall KMO of the questionnaire maintained a high significant correlation (0.80) and therefore the questionnaire was valid for use in future studies. Also, it was observed that the correlation matrix of the variables was related by showing significance in Bartlett's test of sphericity (p = 0.0001).
The reliability of the questionnaire obtained a Cronbach's alpha greater than 0.90, except for the degree of knowledge block (0.63). The factor analysis showed a total variance explained greater than 75%, except for the degree of knowledge block (62%) (Table 2).
Table 2 Exploratory factorial analysis of the questionnaire applied to veterinary students.
| PC | V | VEP (%) | VA (%) | KMO | B | α C |
|---|---|---|---|---|---|---|
| Block 1: Perception of animal welfare as an attribute to be incorporated into meat during the production process (n = 20) | ||||||
| I.- AW | 13.75 | 68.79 | 68.79 | |||
| II.- Minimum standards | 1.30 | 6.50 | 75.29 | 0.963 | 0.0001 | 0.9630 |
| Block 2: Perception of animal welfare as an attribute to be incorporated into meat during the labeling process (n = 9) | ||||||
| I.- AW Labeling | 7.12 | 71.16 | 75.29 | 0.909 | 0.0001 | 0.9090 |
| Block 3: Knowledge of certified production units in animal welfare students by component (n=9) | ||||||
| I.- AW Seal | 2.08 | 23.14 | 23.14 | |||
| II.- Hygiene and toxicological | 1.35 | 15.00 | 38.15 | |||
| III.- Social quality | 1.19 | 12.37 | 62.54 | 0.637 | 0.0001 | 0.6370 |
| Block 4: Meat consumption preference due to meat attributes by component (n=23) | ||||||
| I.- Nutritional and Sensory Factors | 16.758 | 72.86 | 72.86 | |||
| II.- Market factors | 1.25 | 5.44 | 78.31 | 0.964 | 0.0001 | 0.9640 |
PC: Principal components; V: Variance; VEP: Partially explained variance; VA: Cumulative variance; KMO: Kaiser-Meyer-Olkin test; B: Bartlett's test of sphericity;( C: Cronbach's alpha; AW: Animal welfare. * p < 0.0001.
Socioeconomic characteristics and meat preference of FMVZ students
The total enrollment of students was 508. A total of 244 (48%) participated in the study: of which 56% were female and 44% male (Table 3). There was no difference in participation according to gender ((2, p = 0.073). The percentage distribution of area of occupational interest (AOI) was also not different ((2, p = 0.073). The training core (TN) was different among the three groups ((2, p = 0.0001). Economically dependent students were 54% and independent students were 46% ((2, p > 0.05). The values of who buys meat: parents (71%), self (20%), and relatives (7%) ((2, p < 0.05).
On the other hand, household income was: 71% earned less than 480.7 USD; followed by 24% who reported an income between 480.7 and 961.5 USD per month and only 5% had a household income higher than 961.5 USD per month ((2, p = 0.0001). The number of household members was 4.5 ± 1.4. Fifty-four percent of the students were dependent on their parents for economic support. The frequency of meat consumption by species showed that chicken meat was the most consumed, more than three times a week (50%), followed by beef, consumed less than twice a week (48%). Sixty-five percent of the students reported in two years not having eaten turkey ((2, p = <0.0001). 53% ((2, p = <0.0001) sheep meat and goat meat 65% ((2, p = <0.0001).
Obtained data suggest that, if meat were equally priced per kilogram, meat consumption preference would have the following hierarchy, from highest to lowest: beef, chicken, pork, fish, sheep, goat, and turkey.
Table 3 Socioeconomic characteristics of veterinary students.
| Descriptive variables | F | % | (2 | p-value | |
|---|---|---|---|---|---|
| Gender | 1: Female | 136 | 56 | 3.213 | 0.0730 |
| 2: Male | 108 | 44 | |||
| Area of interest | 1: Production | 108 | 44 | 3.213 | 0.0730 |
| 2: Medicine | 136 | 56 | |||
| Training nucleus | 1: Basic | 61 | 24 | 33.598 | <0.0001 |
| 2: Discipline | 124 | 51 | |||
| 3: Professionalizing | 59 | 25 | |||
| Are you economically dependent? | 1: Yes | 133 | 54 | 1.984 | 0.1590 |
| 2: No | 111 | 46 | |||
| Who buys the meat for consumption? | 1: You | 48 | 20 | 430.426 | <0.0001 |
| 2: Spouse | 2 | 1 | |||
| 3: Partners | 2 | 1 | |||
| 4: Parents | 174 | 71 | |||
| 5: Family members | 18 | 7 | |||
| Monthly family income1 | 1: Less than 480.7 | 174 | 71 | 170.270 | <0.0001 |
| 2: Between 480.7 and 961.5 | 57 | 24 | |||
| 3: More than 961.5 | 13 | 5 | |||
1 Monthly family income expressed in U.S. dollars. * p < 0.0001.
Perception of animal welfare during the production process. The results on AW showed that 46% of the students had a positive perception (Figure 3A). However, 39% considered a negative one and 15% were neutral ((2, p = 0.0083). In the occupational area of interest, it was observed that 25% of students in the area of medicine (AM) considered it harmful to incorporate AW as an attribute, these agreed with 14% of respondents in the area of animal production (AP). The neutral response of students with interest in the AM area was lower (5%) compared to the AP group (10%) ((2, p = 0.0083). Both groups (AP 21% and AM 25%) had a positive response totaling 46%. Both GE and TN had significant differences in the perception of well-being ((2, p = 0.2014 and (2, p = 0.5537). The perception in the factor analysis by components is shown in Table 4. The female gender favored the incorporation of AW as an attribute of the meat for the production process, compared to the male gender (Wilcoxon, p = 0.048). The students that formed the basic NT agreed (Kruskal-Wallis, p = 0.0076) with respect to the other cores in the incorporation of AW as an attribute.
Animal welfare during the labeling process. Students were largely positive about the inclusion of AW information as an attribute of meat in the labeling process (Figure 3B). Seventy-seven percent were positive, followed by 15% negative, and 7% neutral ((2, p = 0.0001). No differences were observed in relation to GE ((2, p = 0.2581) or by NT (p > 0.05). Nor in relation to AOI ((2, p = 0.4506). In the factor analysis by components, no differences were observed for GE (Wilcoxon, p = 0.999) or TN (Kruskal-Wallis, p = 0.166), but differences were observed for AOI (Wilcoxon, p = 0.0152; Table 4). Most students considered the incorporation of AW into the labeling process to be positive.
Table 4 Perception of AW as an attribute in the production and labeling process.
| Component | GE | p-value | AOI | p-value | TN | p-value | ||||
|---|---|---|---|---|---|---|---|---|---|---|
| F | M | AP | AM | B | D | P | ||||
| CPP I Mean ± SD | 4.3±1.1 | 4.0±1.4 | 0.0481* | 4.2±1.2 | 4.1±1.3 | 0.4321 | 4.0±1.2 | 4.4±1.2 | 3.9±1.4 | 0.0662 |
| EE | 0.1674 | 0.1686 | 1.2974 | |||||||
| Median | 129.4 | 113.7 | 0.048* | 121.1 | 123.7 | 0.7103 | 134.4 | 107.7 | 112.4 | -- |
| Wilcoxon | 12283 | 13368 | ||||||||
| Kruskal-Wallis | 3.953 | 0.0468* | 0.7131 | 0.7001 | 9.753 | 0.0076* | ||||
| CPP II Mean ± SD | 3.0±1.6 | 3.2±1.5 | 0.2996 | 3.2±1.5 | 2.9±1.6 | 0.2425 | 3.0±1.7 | 3.1±1.5 | 3.0±1.6 | 0.8682 |
| EE | 0.206 | 0.206 | 1.609 | |||||||
| Median | 119.0 | 126.8 | 0.3737 | 127.1 | 118.7 | 0.3467 | 119.8 | 124.5 | 120.8 | -- |
| Wilcoxon | 13704 | 13855 | ||||||||
| Kruskal-Wallis | 0.795 | 0.3724 | 0.890 | 0.3452 | 0.239 | 0.887 | ||||
| CPE I Mean ± SD | 3.91±1.1 | 3.81±1.3 | 0.5589 | 4.05±1.2 | 3.72±1.2 | 0.0384* | 3.96±1.2 | 3.97±1.1 | 3.54±1.4 | 0.0718 |
| EE | 0.162 | 0.160 | 1.248 | |||||||
| Median | 122.5 | 122.4 | 1 | 134.2 | 113.1 | 0.0152* | 127.6 | 126.8 | 108.1 | -- |
| Wilcoxon | 13229 | 14503 | ||||||||
| Kruskal-Wallis | 0.0009 | 0.9992 | 5.984 | 0.0144* | 3.583 | 0.1666 | ||||
CPPI: Animal Welfare; CPPII: Minimum Standards; CPEI: Animal Welfare Labeling; TN: Training Core; GE: Gender; AOI: Occupational Area of Interest; F: Female; M: Male; AP: Production; AM: Medicine; B: Basic; D: Disciplinary; P: Professional; EE: Standard error: Disciplinary; P: Professionalizing; SE: Standard error. * p < 0.05.
Knowledge about production units certified in Mexico with animal welfare. The results of knowledge of certified production units in Mexico with AW are shown in Figure 3C. Most students had high knowledge (82%), followed by medium knowledge (11%) and only 7% obtained low knowledge ((2, p = <0.0001). No differences were observed by GE ((2, p = 0.8922), TN ((2, p = 0.2410), or AOI ((2, p = 0.1351). There were no differences by component (p ≥ 0.05, Table 5).
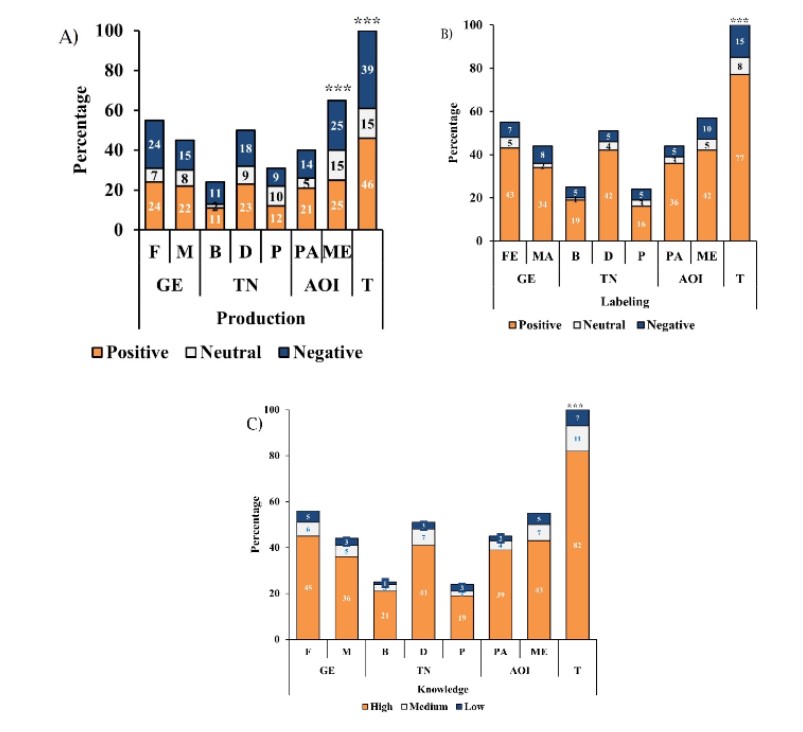
Figure 3 . Perception of the students about animal welfare as an attribute to incorporate into the meat during the process of A) production, B) labeling, and C) knowledge. Based on the GE (gender, F: Female and M: Male); TN (training core, B: Basic, Disciplinary, and P: professionalizing) and AOI (area of occupational interest, AP: Production and AM: Medicine. T: total population). *** p < 0.001.
Table 5 Knowledge about animal welfare certified units in students.
| Component | GE | p-value | AOI | p-value | TN | p-value | ||||
|---|---|---|---|---|---|---|---|---|---|---|
| F | M | AP | AM | B | D | P | ||||
| C I | ||||||||||
| Mean ± SD | 2.7±0.6 | 2.7±0.5 | 0.6780 | 1.9±0.2 | 1.9±0.2 | 0.9732 | 1.9±0.2 | 1.9±0.2 | 1.9±0.2 | 0.3951 |
| EE | 0.075 | 0.030 | 0.232 | |||||||
| Median | 121.4 | 119.5 | 0.4880 | 119.2 | 125.0 | 0.4463 | 122.1 | 126.9 | 113.5 | 0.3670 |
| Wilcoxon | 12910 | 12877.5 | ||||||||
| Kruskal-Wallis | 0.480 | 0.583 | 2.004 | |||||||
| C II | ||||||||||
| Mean ± SD | 2.7±0.3 | 2.6±0.3 | 0.1499 | 2.7±0.3 | 2.7±0.3 | 0.9060 | 2.7±0.3 | 2.7±0.3 | 2.6±0.3 | 0.1163 |
| EE | 0.043 | 0.043 | 0.337 | |||||||
| Median | 127.3 | 116.45 | 0.1937 | 123.7 | 121.4 | 0.7838 | 121.8 | 129.13 | 109.2 | 0.1466 |
| Wilcoxon | 12577 | 13368 | ||||||||
| Kruskal-Wallis | 1.701 | 0.1921 | 0.076 | 0.7828 | 3.812 | |||||
| C III | ||||||||||
| Mean ± SD | 2.8±0.3 | 2.8±0.3 | 0.6208 | 2.8±0.3 | 2.8±0.3 | 0.6466 | 2.8±0.2 | 2.8±0.3 | 2.7±0.3 | 0.2447 |
| EE | 0.041 | 0.041 | 0.323 | |||||||
| Median | 123.17 | 121.65 | 0.8321 | 125.24 | 120.23 | 0.4747 | 131.63 | 121.38 | 115.4 | 0.2609 |
| Wilcoxon | 13138.5 | 13537.5 | ||||||||
| Kruskal-Wallis | 0.045 | 0.514 | 2.687 | |||||||
C I: Animal welfare seal; C II: Hygiene and toxicological; C III: Social quality; GE: Gender; TN: Training Nucleus; AOI: Occupational area of interest; F: Female; M: Male; AP: Production; AM: Medicine; B: Basic; D: Disciplinary; P: Professional; EE: Standard error; S: Standard error: Disciplinary; P: Professionalizing; SE: Standard error. * p < 0.0001.
Meat consumption preference by meat attributes
Preference for meat consumption by attributes: nutritional, meat sensory (flavor, odor, color, fat content, and juiciness), and market (brand, packaging, cut selection, label, advertising, product seasonality, and animal welfare practices) was better valued by the female gender (CI, Wilcoxon p = 0.0293). This is shown in Figures 1 and 2. It was also observed that there were no differences in the valuation of meat consumption preference, due to meat attributes as a function of AOI, nor by NT (p > 0.05 Table 6).
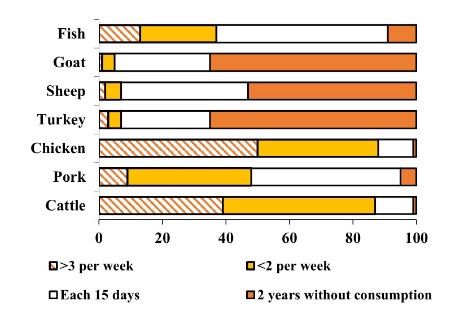
Table 6 Meat consumption preference due to the meat attributes by component.
| Component | GE | p-value | AOI | p-value | TN | p-value | ||||
|---|---|---|---|---|---|---|---|---|---|---|
| F | M | AP | AM | B | D | P | ||||
| C I | ||||||||||
| Mean ± SD | 4.0±1.3 | 3.8±1.5 | 0.0361* | 4.0±1.4 | 4.0±1.4 | 0.9629 | 4.1±1.4 | 4.0±1.4 | 3.9±1.4 | 0.8066 |
| EE | 0.185 | 0.187 | 1.450 | |||||||
| Median | 130.2 | 112.7 | 0.0303* | 121.9 | 122.9 | 0.9105 | 127.6 | 123.3 | 115.4 | 0.5529 |
| Wilcoxon | 12175 | 13175 | ||||||||
| Kruskal-Wallis | 4.749 | 0.012 | 1.185 | |||||||
| C II | ||||||||||
| Mean ± SD | 3.80±1.2 | 3.65±1.3 | 0.3719 | 3.80±1.3 | 3.69±1.3 | 0.5001 | 3.75±1.3 | 3.75±1.3 | 3.71±1.3 | 0.9799 |
| EE | 0.169 | 0.169 | 1.318 | |||||||
| Median | 124.6 | 119.7 | 0.5790 | 126.7 | 119.1 | 0.3862 | 125.0 | 122.4 | 119.0 | 0.9138 |
| Wilcoxon | 12938 | 13686 | ||||||||
| Kruskal-Wallis | 0.3097 | 0.7554 | 0.180 | |||||||
C I: Nutritional and sensory factors; C II: Market factors; GE: Gender; TN: Training Nucleus; AOI: Occupational area of interest; F: Female; M: Male; AP: Production; AM: Medicine; B: Basic; D: Disciplinary; P: Professional; EE: Standard error: Disciplinary; P: Professional; EE: Standard error. * p < 0.05.
Discussion
Content Validity, Construct Validity, and Reliability of the Questionnaire.
Content validity has been estimated in several studies using several methods: Tuckey's factor analysis, Lawshe's index, Rovinelli and Hambleton index, Aiken's V, Sireci and Geisinger's cluster analysis, Levine, Maye, Ulm, and Gordon's minimum ability method, Fitch's symmetry method, Rubio's factor analysis, Claeys, Neve, Tulkens, and Spinewine's index, and Hernández-Nieto's method (2002). Some of these procedures are only designed to measure the agreement between two judges, while others require a specific number of judges (Galicia et al., 2017). The Hernández-Nieto method (2002) assesses the degree of agreement between judges on a per-item basis and requires a minimum of three judges (Pedrosa et al., 2014). These authors recommend keeping the content validity coefficient (CVC) higher than 0.80. Thus, the questionnaire was classified as good to excellent since it obtained a CVC of 0.85. Likewise, in the eating behavior study proposed by Marquez-Sandoval et al. (2014), the average score obtained was 42.5 out of 45 (n=15), in this research, a total score of 38.5 (out of 45 possible points, n=4), was obtained. Transforming the score of 45 to 100% and obtaining the corresponding index of the total score, we had an index of 0.85, which is comparable to the result obtained by the methodology of Hernández-Nieto, (2002).
The KMO contrasts the partial correlations between the variables and allows us to know if the variables maintain a dimensional structure that is invariant. The results showed that the overall KMO of the questionnaire maintained a high significant correlation (0.8). This means that the questionnaire is valid for future research (Lacave et al., 2015). Likewise, it was observed that the correlation matrix was related by obtaining significance in Bartlett's test of sphericity (p = 0.0001). These results were superior to those observed by Jiménez, (2011) in his study "Analysis of animal welfare as an attribute to be incorporated in pork", where a KMO of 0.59 was found. In another study, Miranda-de la Lama et al. (2017) found a KMO of 0.80, similar data to the present study.
The questionnaire obtained a Cronbach's alpha of 0.96, thus, it is reliable. Márquez-Sandoval et al. (2014), in their study "Design and validation of a questionnaire to assess eating behavior in Mexican health students", found similar results. On the other hand, Miranda-de la Lama et al. (2017) in their study "Perceptions and attitudes of Mexican consumers towards farm animal welfare and their willingness to pay for welfare-friendly meat products" found a Cronbach's alpha of 0.66. The minimum acceptable value for Cronbach's alpha coefficient is 0.70, below which the internal consistency of the scale used is low (Oviedo & Campos, 2005). Our questionnaire was reliable and consistent.
Socioeconomic Characteristics and Meat Preferences of FMVZ Students
The students of the basic and disciplinary core were more participative compared to those of the professionalizing core. Ceballos-Olvera et al. (2021) reported that this was due to the greater empathy of the students for the AW topic, in the first semesters of the veterinary career. Similarly, most students in the first semesters rely on their parents to buy meat for family consumption. Forty-six percent are not economically dependent. The family income of the majority is less than USD 480.7 per month. This figure is considered low-income (Alvarado-Lagunas et al., 2012). The majority of FMVZ-UAT students come from low-income families, and some may have to seek income-generating activities while studying.
The number of family members was 4.5, similar to that reported by INEGI (2021). On the other hand, Núñez-López et al. (2012) concluded that the size of the family (2 to 5 members, 79.5%) influenced the amount and frequency of meat consumed per week. The lower the income, the inclusion of other less preferred species was observed. In low-income families, chicken and pork were consumed. Alvarado-Lagunas et al. (2012) found that in the Valley of Mexico, the purchase and preference of chicken were influenced by the number of family members (the more people, the lower the consumption), income (only 11.6% had a high income, USD 913.39 per month), and price (the higher the price, the lower the purchase). In the present study, it was observed that the consumption of chicken meat was higher compared to other meats. However, beef would be the most consumed meat if the cost per kilogram did not differ among the different types of meat (Figure 2). Alvarado-Lagunas et al. (2012) reported that the preference for chicken meat was high, showing that the main motivation was its nutritional content. On the other hand, beef was ranked second in terms of preference, and this result is similar to that observed in the present research (Figure 1).
Schnettler et al. (2008) showed that consumers in the Bio-Bio and Araucanía regions of Chile had a preference for beef and chicken, and therefore had higher consumption. Similarly, a national trend for chicken consumption was observed in Mexico. Per capita consumption was 33 kg in 2020, making it the most consumed meat by the Mexican population (UNA, 2021). The consumption preference for beef is consistent with that reported by Alvarado-Lagunas et al. (2016), where the consumption preference of young people aged 14 to 21 years in the city of Monterrey is preferably beef. Consumption by students takes place outside the home, and it is also considered a healthy food.
Perception of Animal Welfare During the Production Process
Segovia et al. (2005) found that psychological factors and intrinsic and extrinsic attributes of the meat determine beef consumption behavior. On the other hand, Mondragón-Ancelmo et al. (2018) found that the type of animal was important for the type of finished product. Barbacoa, a regional Mexican dish, was created by the influence and customs of the region. Núñez-López et al. (2012) reported that the purchase of beef was related to: family tradition (46.3%), ease of preparation (42.7%), and price (28.9%). Ortega-Gutiérrez et al. (2020) showed that consumption in Ciudad Cuauhtémoc and Delicias Chihuahua (Mexico) was 1 to 2 kg of beef/week. This practice is related to ease of preparation and family tradition, but not to income level. In general, the veterinary and zootechnical student population in northeastern Mexico has a preference for chicken and beef consumption, due to ease of access and family tradition.
AW is positively associated with the quality of meat products (De Aluja, 2011) because it minimizes animal suffering, as animals are considered sensitive beings, and enriches the marketing strategies of meat products (Del Campo, 2006). In Italy, 48% of consumers accept the social responsibility of AW and therefore there is a demand for products with AW attributes (Vecchio & Annunziata, 2012). In the Papaloapan region of Veracruz, Mexico, 42% of consumers would be willing to pay 5% more for beef with certified quality and safety (Vilaboa-Arroniz et al., 2009). For their part, Miranda de la Lama et al. (2017) showed that consumers in self-service stores are willing to pay for a product certified with good AW practices. Therefore, it can be shown that the perception of AW will be positioned with a greater boom in the coming years and will be a value-added attribute in meat products in the domestic market.
In the context of veterinary and zootechnical students, PAs, compared to MEs, promote the implementation of AW practices in the production process. This can be explained by the fact that jobs in PA depend on the sale of live animals or meat products. They also depend on the sale of feed, feedlots, or TIF (Federal Inspection Type) slaughterhouses.
Animal Welfare During the Labeling Process
Similarly, Jiménez (2011) reported that students from the three university faculties of medicine, engineering, and agronomy in Santiago de Chile considered it positive that the label of the meat product should have an animal welfare seal. If it existed, they would pay more for it, in addition to the intrinsic qualities of the meat and the price. Customers in the state of Mexico, Mexico want the label to show information on health, environmental protection, AW, or benefits for local producers (Santurtún-Oliveros et al., 2012). Alonso et al. 2020 point out that in the last two decades, the number of consumers has increased. They demand more ethical production systems and refuse to buy products that do not comply with AW concerns. Therefore, there is an interest among students to obtain information on the treatment of animals and thus have a higher quality product label. This is reflected in the establishment of AW policies. In this study, a discrepancy was observed between the desire for the inclusion of AW in product labeling (total 77%) and the positive perception of the implementation of AW in production (total 46%). More emphasis may be needed in the basic courses to clarify the aspects related to production and labeling with AW.
Knowledge of Certified Animal Welfare Production Units in Mexico
Alvarado-Lagunas et al. (2016) found that students of the Faculty of Accounting and Administration in Monterrey, Mexico, in their majority (91%), indicated that they did not know the meaning of AW, production systems, or feedlots. These results may be because students of veterinary medicine and animal husbandry have subjects related to AW: Bioethics Seminar, Animal Management, and Behavior, while this is not the case with careers in the field of exact sciences: Engineering and Accounting.
The majority of students had high knowledge (82%), followed by medium knowledge (11%) and only 7% were low. In this sense, Jimenez, (2011) found a segmentation of 33% of informed students and the rest had no knowledge or were indifferent to pork attributes: product traceability and product origin.
Preference of Meat Consumption by Meat Attributes
The difference by gender was because they have a high level of emotional empathy for animals compared to male students (Paul & Podberscek, 2000). Another explanation may be that women are in charge of shopping for food preparation at home. They check the labels at the time of purchase. Ortega-Gutiérrez et al. (2020) reported that in the cities of Cuauhtémoc (74%) and Delicias (78%) in Chihuahua, Mexico, women are the ones who decide on the type of meat consumed at home.
Obtained data show that chicken is consumed more than three times a week, followed by beef, twice a week. This is in agreement with Alvarado-Lagunas et al. (2012), who reported that the preference for chicken meat was high. The main reason for its consumption was the consideration of high nutritional value, with beef in second place (Schnettler et al., 2008; UNA, 2021). The preference for beef consumption is also consistent with that reported by Alvarado-Lagunas et al. (2016) where beef consumption was through grilled beef tacos, hamburgers, or stews. These authors mention that this student consumption is frequently carried out outside the home, and young people consider it to be a healthy food. Segovia et al. (2005) suggest that psychological factors and consumer characteristics determine beef consumption behavior. Also, Núñez-López et al. (2012) suggest that beef purchase was related to family tradition (46.3%), ease of preparation (42.7%), and price (28.9%). Similarly, Ngapo et al. (2017) mentioned that the Mexican market is influenced by a variety of domestic consumer preferences: Mexico City, Guadalajara, Hermosillo, and Veracruz. They also observed that the most important criterion was fat coverage, with 62% preferring low coverage and marbling, and 59% preferring no marbling. This was followed by dark red meat color (29%) and light red color (24%).
Preference for meat consumption based on meat attributes was better evaluated by the female gender, perhaps because of emotional empathy or because of shopping and observing labels (Paul & Podberscek, 2000; Ortega-Gutiérrez et al., 2020).
Conclusions
The questionnaire designed to assess the perception of veterinary students on meat consumption was valid. Different types of meat are preferred according to economic characteristics and intrinsic qualities.
Students are interested in meat produced with AW. This is a desirable attribute for new generations of veterinarians. There are AW courses in veterinary curricula; however, there is a need to monitor AW livestock production led by graduates to observe the inherent strengths and weaknesses.
It is important to develop public policies that include measures for the meat industry that promote the welfare of animals destined for consumption.

