nueva página del texto (beta)
 Inglés (pdf)
 Artículo en XML
 Referencias del artículo
 Enviar artículo por email
 Citado por SciELO
  Similares en
SciELO
Similares en
SciELO 
 Permalink
Introduction
Globally, an increasing amount of natural disasters takes place every year. This includes climatological, meteorological, hydrological and geophysical disasters (Center for Research on the Epidemiology of Disasters [CRED], 2020). In 2018 alone, natural disasters caused losses of US$ 132 billion and affected more than 68 million people globally (CRED, 2019). Its frequency and severity are expected to increase, in the future, as a consequence of climate change (Intergovernmental Panel on Climate Change [IPCC], 2018).
Undoubtedly, the occurrence of a disaster reduces the well-being of those affected (Rabassa et al., 2014; González, 2020). From the impact on their health, damage to infrastructure, and even destruction of the natural environment, the effect appears to be unambiguous. However, its impact on economic activity -and in particular on output growthdoes not seem so evident. Thus, three theoretical hypotheses have been postulated regarding the impact of natural disasters on economic growth (Hsiang and Jina, 2014).
In the first place, a recovery to the trend is conceivable. This is, after the disaster, a lower GDP growth is observed, associated with the destruction of physical and human capital. However, given the relative capital shortage in the affected region, a capital inflow occurs and temporarily raises growth above pre-disaster levels. Eventually the inflow of capital stops and growth returns to that corresponding to the steady state of the economy. This is the standard prediction of neo-classical growth models. The empirical evidence seems to support the prediction of a wealth flow, although no migratory flows to the affected areas are observed.
Second, the non-recovery hypothesis holds that the economy does not return to its previous steady state. That is, the capital flow is tempered by other effects. A broad drop in consumption can raise its marginal utility so that it is preferable to productive investments. Although the growth rate returns to its pre-disaster levels, output will be sustained lower.
Third, the build back better hypothesis predicts that after a brief period of slower growth due to loss of capital, this is replaced by new capital more productive than the destroyed. This results in an increase in the GDP growth rate and in a new (and better) steady state. Here it is assumed that, in the absence of disaster, companies do not efficiently update their capital stock. This may be due to restrictions on access to credit and which would be relaxed post-disaster. In a related way, the creative destruction hypothesis maintains that, even in the short term, greater economic growth can be observed given the greater demand for reconstruction goods and services. This seems to be especially true for sectors such as construction.
Empirical evidence has reported mixed results. On the one hand, a large group of works suggests a negative and significant effect, derived from the occurrence of a natural disaster, on growth -in the short term (Noy, 2009; Strobl, 2011; Berlemann and Wenzel, 2016; IMF, 2018; González et al., 2021a). Other studies, however, report a positive effect on growth (Albala-Bertrand, 1993; Skidmore and Toya, 2002; Porcelli and Trezzi, 2018). The absence of significant effects has been reported in Cavallo et al. (2013) who point out that only those catastrophic disasters -above the 99th percentile of the global distribution of mortality from disastersthat lead to a situation of institutional instability reduce economic growth.
In this context, the objective of this work is to synthesize the empirical evidence regarding the impact that the occurrence of natural disasters has on economic growth. For this, this work implements meta-analysis and meta-regression techniques. To the best of our knowledge, this work contributes to the disaster literature in two ways. First, it updates the available evidence on this topic by considering, in the meta-analysis, works published until March 2020 -while the existing background only includes works published until 2014-. Second, it provides evidence of temporal differences in the impact of natural disasters. That is, it distinguishes between contemporary effect and lagged effects. The findings of this work constitute a wake-up call towards the implementation of mitigation and adaptation policies against natural disasters and climate change, which must consider different levels of government and be multidimensional (Kashwan, 2018).
Meta-analysis is a technique that allows synthesizing the empirical evidence in a statistically robust way and estimating a combined effect -considering evidence from different studies (Florax et al., 2002). In contexts of conflicting results, the meta-analysis and the meta-regression allow explaining the existing differences (i.e. different geographic or temporal scope, econometric specification or source of information). Initially used in Medicine, this systematic review technique has become frequent in Economics (Stanley, 2001) and its application includes topics such as the effectiveness of labor policies (Card et al., 2010), education and growth (Benos and Zotou, 2014), discrimination (Lane, 2016), publication bias (Andrews and Kasy, 2019) or elasticity of demand (Havranek and Sokolova, 2020).
Previously, three studies have advanced in the joint study -by means of meta-analysis techniquesof the existing empirical evidence on the impact of natural disasters on economic growth (Lazzaroni and van Bergeijk, 2013; Klomp and Valckx, 2014; van Bergeijk and Lazzaroni, 2015). Lazzaroni and van Bergeijk (2013) find mixed results when considering publications made between 2002-2013 and using a multinomial logistic model. In particular, they find that the probability of reporting a negative and significant estimate, among the studies considered, is 38% followed by non-significant estimates (36%) and positive and significant estimates (26%). When distinguishing between estimates that report direct effects of natural disasters (destruction of physical assets) from those that refer to their indirect effects (lower economic flows), they find that the latter have an 88% greater probability of reporting a positive and significant effect. That is, there is a greater consensus in relation to the destruction of physical assets caused by the occurrence of natural disasters than in relation to its negative impact on economic growth.
Klomp and Valckx (2014) report evidence in favour of the existence of a negative impact of natural disasters on GDP growth. This impact is increasing over time and greater among developing countries and for climate disasters. The authors also find evidence in favour of the existence of publication bias among the studies considered2. van Bergeijk and Lazzaroni (2015) proceed with a meta-analysis on the same topic and contrast their results with those that arise from a systematic review of the literature carried out in IPCC (2012) 3. They argue that the level of confidence about the existence of a negative effect caused by natural disasters is higher if the standard literature review is complemented by the meta-analysis. Their results also suggest that there is a greater consensus regarding the direct effects of disasters than in relation to their indirect effects.
Hereafter, section 1 describes the sources of information and methodology. Section 2 presents the main results, while section 3 discusses the main conclusions of the work.
1. Methodology
The relevant studies were selected based on a searching by keywords (“economic growth” and “natural disasters”) in three well-known search engines: Scopus, Science Direct and Google Scholar. Those studies published between 2015-2020 were considered -that is, since the last meta-analysis to the authors' knowledge-. These studies include refereed journal publications and working papers. The search ended on March 20, 2020.
Those studies consisting of autoregressive vector models or input-output matrices were not considered, since the former do not present tabulated results -but impulse-response functionsand the latter do not provide standard deviations (Lazzaroni and van Bergeijk, 2013). Nor were considered studies that only report the standard deviations of the significant coefficients, those that do not report the deviations or those that do not indicate the number of observations. Studies using any proxy of the output -such as night lightswere ruled out4.
In total, 681 estimates relating natural disasters to economic growth were included, corresponding to 19 studies. These studies typically proceed with a Barro-type empirical panel strategy as the following:
Where y it,t-1 is the growth rate of the logarithm of GDP for the observational unit i (frequently countries) between the years t y t-1. Disasterit is the variable of interest and that captures exposure to disasters (simple count of their frequency or some measure that includes a weight for their severity). Xit it is a vector of covariates that include different controls (unobserved heterogeneity, openness to international trade, human capital, quality of institutions, etc.) and εit is the model error term.
All the considered estimates refer to the effect of natural disasters on the growth rate of the GDP in no case on the output in levels. Furthermore, 69% of the estimates refer to the contemporary effect of natural disasters, that is, the effect within the year of their occurrence. The remaining 31% consider at least one annual lag of the effect. Table 1 details the 19 studies considered.
Table 1 Studies incorporated in the meta-analysis
| STUDY | NUMBER OF ESTIMATES | PERIOD | NUMBER OF COUNTRIES | PUBLISHED IN JOURNAL | SJR IMPACT FACTORb |
| Guo et al. (2015) | 6 | 1985-2011 | 1 | Yes | 0.58 |
| Hochrainer-Stigler (2015)a | 8 | 1970-2006 | . | Yes | -- |
| Berlemann and Wenzel (2016) | 3 | 1960-2002 | 153 | Yes | 0.20 |
| López et al. (2016) | 6 | 1970-2013 | 184 | No | -- |
| Mu and Chen (2016) | 28 | 1990-2012 | 1 | Yes | 0.81 |
| Okuyama (2016) | 11 | 1975-2006 | 1 | Yes | -- |
| de Oliveira (2017) | 60 | 2002-2011 | 1 | No | -- |
| SELA-UNISDR (2017) | 5 | 1970-2014 | 10 | No | -- |
| Bakkensen and Barrage (2018) | 9 | 1970-2015 | 182 | No | -- |
| Brata et al. (2018) | 10 | 2006 | 1 | Yes | -- |
| IMF (2018) | 128 | 1980-2016 | 12 | No | -- |
| Ishizawa and Miranda (2018) | 16 | 1983-2010 | 6 | Yes | 1.40 |
| Lima and Barbosa (2018) | 54 | 2008-2010 | 1 | Yes | 0.91 |
| Porcelli and Trezzi (2018) | 80 | 1986-2011 | 1 | Yes | 0.59 |
| Zhao et al. (2018) | 34 | 2003-2013 | 1 | Yes | 0.58 |
| Heger and Neumayer (2019) | 60 | 2006-2012 | 1 | Yes | 3.58 |
| Mantey et al. (2019) | 64 | 1980-2015 | 50 | No | -- |
| Panwar and Sen (2019) | 39 | 1981-2015 | 29 | Yes | -- |
| Parida et al. (2020) | 60 | 1981-2011 | 1 | Yes | 0.55 |
Source: own elaboration
aProvides estimates on a global scale without specifying the number of countries included. bRefers to the impact factor of Scimago Journal Rank (SJR) as reported, for 2019, at https://www.scimagojr.com/. Those journals not indexed in Scopus do not have an impact factor.
Two estimates are made in this work: the combined effect of the point estimates of all the studies (meta-analysis) and an explanatory regression of the heterogeneity present between the included studies (meta-regression). In both cases a random effects model is considered and STATA 16.1 is used for its computation.
The combined effect
Where wi is the weight received by the study i;
Where es
The meta-regression incorporates, as explanatory, dummy variables that try to explain the heterogeneity observed between the different estimates. Equation 4 details the estimation strategy used:
Where βji refers to the point estimate j of study i ; Xji is a vector of relevant regressors; ε i is the specific deviation of study i with respect to the average of the distribution of effects; µji is the random error term. The regressor vector considered in this work is described below in Table 2.
Table 2 Regressors considered in meta-regression
| REGRESSOR | DESCRIPTION |
| Developing countries | 1 if considers developing countries (non-OECD members), 0 otherwise |
| Decade of 2010 | 1 if considers disasters that occurred in the 2010s, 0 otherwise |
| Decade of 2000 | 1 if considers disasters that occurred in the 2000s, 0 otherwise |
| Climatological | 1 if considers climatological disasters, 0 otherwise |
| Hydrological | 1 if considers hydrological disasters, 0 otherwise |
| Meteorological | 1 if considers meteorological disasters, 0 otherwise |
| Geophysical | 1 if considers geophysical disasters, 0 otherwise |
| Single disaster | 1 if considers a single disaster, 0 otherwise |
| EM-DAT | 1 if uses the EM-DAT data, 0 otherwise |
| Data panel | 1 if estimates a panel specification, 0 otherwise |
| Dynamic model | 1 if considers the lag of the dependent variable as regressor, 0 otherwise |
| Time fixed effects | 1 if considers time fixed effects, 0 otherwise |
| Idiosyncratic fixed effects | 1 if considers idiosyncratic fixed effects, 0 otherwise |
| Published in journal | 1 if the study is published in a journal, 0 otherwise |
| Disaster severity | 1 if weights by the severity of natural disasters, 0 otherwise |
| Environ. and geography. controls | 1 if considers environmental or geographic controls, 0 otherwise |
| International trade controls | 1 if considers international trade controls, 0 otherwise |
| Human capital controls | 1 if considers human capital controls, 0 otherwise |
| Initial GDP control | 1 if considers initial GDP controls, 0 otherwise |
| Financial market development controls | 1 if considers financial market development controls, 0 otherwise |
| Institutional controls | 1 if considers institutional controls, 0 otherwise |
| Endogeneity controls | 1 if considers endogeneity controls, 0 otherwise |
Source: own elaboration
2. Results
The estimate of the combined effect of the occurrence of natural disasters on economic growth is presented below. A significant and negative combined effect is observed (-0.015). This reflects the fact that most studies report a negative and significant individual effect (11 out of 19 studies), followed by those reporting non-significant effects (7) and a single study with a positive and significant effect. A negative combined effect implies that the occurrence of a natural disaster significantly reduces the GDP growth rate of the affected area. This is consistent with what was previously reported (Lazzaroni and van Bergeijk, 2013; Klomp and Valckx, 2014; van Bergeijk and Lazzaroni, 2015).
Table 3 also shows a wide heterogeneity between the individual estimates of different studies. Thus, an average individual effect (negative and significant) of -1.9 is reported in IMF (2018), while an individual effect (positive and significant) of 0.058 arises from Porcelli and Trezzi (2018). Furthermore, the presence of heterogeneity in the estimated effect can be observed when considering different groups of point estimates (Graph 1).
Table 3 Combined and study effect of natural disasters on economic growth
| STUDY | EFFECT | P-VALUE | LL 95% | UL 95% |
| Guo et al. (2015) | 0.000 | 0.999 | -0.050 | 0.050 |
| Hochrainer-Stigler (2015) | -0.001 | 0.286 | -0.004 | 0.001 |
| Berlemann and Wenzel (2016) | -0.046*** | 0.000 | -0.066 | -0.026 |
| López et al. (2016) | -0.168* | 0.067 | -0.347 | 0.012 |
| Mu and Chen (2016) | -0.002*** | 0.000 | -0.002 | -0.001 |
| Okuyama (2016) | 0.038 | 0.178 | -0.017 | 0.094 |
| de Oliveira (2017) | -0.002*** | 0.000 | -0.003 | -0.001 |
| SELA-UNISDR (2017) | -0.001 | 0.776 | -0.007 | 0.006 |
| Bakkensen and Barrage (2018) | -0.133** | 0.011 | -0.235 | -0.031 |
| Brata et al. (2018) | -1.396** | 0.027 | -2.635 | -0.156 |
| IMF (2018) | -1.926*** | 0.000 | -2.106 | -1.745 |
| Ishizawa and Miranda (2018) | -0.011*** | 0.000 | -0.013 | -0.009 |
| Lima and Barbosa (2018) | -0.055*** | 0.000 | -0.067 | -0.044 |
| Porcelli and Trezzi (2018) | 0.058** | 0.033 | 0.005 | 0.111 |
| Zhao et al. (2018) | -0.541*** | 0.000 | -0.668 | -0.414 |
| Heger and Neumayer (2019) | 0.002 | 0.669 | -0.006 | 0.010 |
| Mantey et al. (2019) | -0.247*** | 0.000 | -0.276 | -0.218 |
| Panwar and Sen (2019) | -0.001 | 0.417 | -0.003 | 0.001 |
| Parida et al. (2020) | -0.000 | 0.625 | -0.002 | 0.001 |
| Combined effect | -0.015*** | 0.000 | -0-018 | -0.012 |
Source: own elaboration
Note: * significant at 10%, ** significant at 5%, *** significant at 1%. A forest diagram with each point estimate (N = 681) is omitted for simplicity.
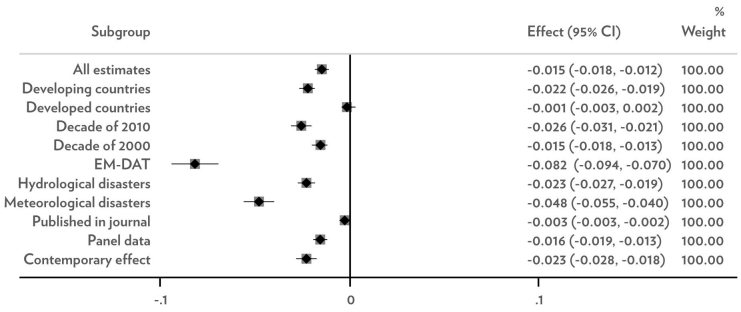
Source: own elaboration Note: each row refers to the combined effect for the specified subgroup. The first row considers all the point estimates and is the same one that appears in Table 3.
Graph 1 Forest plot of total combined effect and by subgroups
From Graph 1 it appears that the negative effect of disasters seems greater in developing countries than in developed ones. In turn, those estimates made considering EM-DAT or meteorological disasters as a source of information tend to report a greater negative effect. Another way to contemplate this wide dispersion, which allows visualizing the point estimates in a disaggregated form, is through funnel plots.
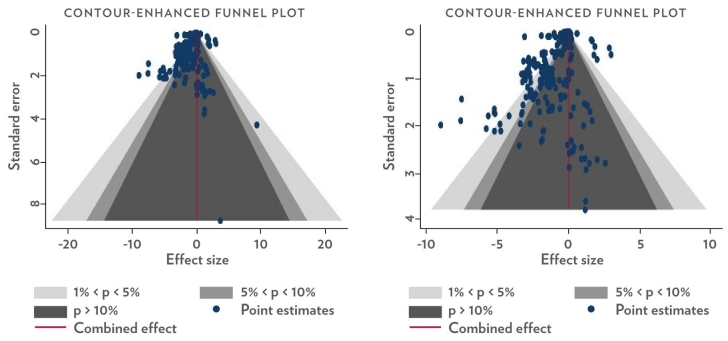
Source: own elaboration Note: The diagram on the left considers the 681 point estimates. The diagram on the right excludes the 2 estimates whose standard deviations are greater than 4. The combined effect is the same as that shown in Table 3 (-0.015).
Graph 2 Funnel plots of point estimates
These plots present the estimated effect and its standard error, for each point estimate, so that the most accurate estimates appear at the top of the plot -the least accurate appear at the bottom. According to the graph, most of the point estimates are negative (490 of 681). Furthermore, of the significant estimates, 83% is negative. Again, a wide dispersion arises when comparing the extremes of these point estimates: -9.006 (Mantey et al., 2019) and 9.33 (Brata et al., 2018). Graphically, the above implies a higher concentration of points in the left half of each diagram. In addition, a wide dispersion of the points is observed between the significance intervals (10%, 5% and 1%) and effect sizes. This is contrary to the idea of publication bias, although this study includes both journal-published studies and working papers.
Logically, it is interesting to delve into the explanation of the observed heterogeneity. Table 4 below presents the results of the meta-regression.
Table 4 Meta-regression effect of natural disasters on economic growth
| COEFFICIENT | STANDARD ERROR | |
| Developing countries | -0.499*** | 0.064 |
| Decade of 2010 | -1.119*** | 0.315 |
| Decade of 2000 | 0.570*** | 0.103 |
| Climatological | -0.203*** | 0.052 |
| Hydrological | -0.061 | 0.045 |
| Meteorological | 0.123** | 0.057 |
| Geophysical | -0.068 | 0.043 |
| Single disaster | -0.010 | 0.087 |
| EM-DAT | -0.251** | 0.111 |
| Data panel | -0.033 | 0.096 |
| Dynamic model | -0.028 | 0.047 |
| Time fixed effects | -1.000*** | 0.110 |
| Idiosyncratic fixed efeccts | 0.664*** | 0.086 |
| Published in journal | 0.346*** | 0.121 |
| Disaster severity | 0.186*** | 0.046 |
| Environ. and geography. controls | 0.079 | 0.086 |
| International trade controls | 0.247** | 0.124 |
| Human capital controls | -0.110 | 0.122 |
| Initial GDP controls | 0.127 | 0.109 |
| Financial market development controls | -0.220* | 0.127 |
| Institutional controls | -0.152 | 0.135 |
| Endogeneity controls | 0.092* | 0.057 |
| N | 681 | |
| R2 | 14.53% | |
| I2 | 98.32% |
Source: own elaboration
Note: * significant at 10%, ** significant at 5%, *** significant at 1%. I2 is a measure of the heterogeneity between studies (proportion of the variability attributable to true heterogeneity) and is constructed from the Cochran Q statistic. See Harris et al. (2008).
Table 4 confirms what was observed in the previous graphic analysis. The negative impact of natural disasters on economic growth is greater in developing countries than in its developed peers. Also, the negative impact is greater for disasters that occurred in the last decade. This is consistent with previous literature that suggests that the impact of disasters -and in general of the consequences of climate changeis greater in more vulnerable economies and that the frequency and intensity of these have increased in recent years, on a global scale (Klomp and Valckx, 2014). The previous results would imply that climate change and disaster mitigation and adaptation policies can contribute to fighting global poverty given that developing countries concentrate a large part of the global poor (Fleming et al., 2007).
In methodological terms, some striking aspects are highlighted. The use of EM-DAT as a source of disaster information has a significantly greater negative impact. This is expected considering the requirements for a disaster to be registered in this database5. Controlling for unobserved heterogeneity -idiosyncratic or temporal(fixed effects) also results in significant differences. Both controls for unobserved heterogeneity are the regressors with the highest absolute value as shown in Table 4, suggesting that their inclusion is relatively more important than other regressors to explain the heterogeneity between studies. In the same sense, considering some measure of disaster severity -instead of using their frequency or an occurrence dummyyields significant differences. These results are robust to the presence of outliers (Table A.2 in Appendix).
A significant part of the heterogeneity between the analyzed studies is explained by the inclusion of international trade, development of financial markets and endogeneity controls. In any case, a large proportion of the heterogeneity between studies cannot be explained by the regressors considered here (R2<15%). In order to strengthen the estimates, Table A.1 (in the Appendix) reiterates the estimates presented in Table 4, incorporating dummies to control for lagged effects (first and second lags). The results provide positive point estimates for both lags -the lagged negative effect of natural disasters would be lower than their contemporary effect. It is highlighted that only 31% of the point estimates refer to lagged effects. In this regard, Klomp and Valckx (2014) point out that less than 10% of the estimates included in their review refer to a period of more than 5 years.
When considering only those studies that report a negative and significant effect, the explanatory power of the model increases considerably (R2>49%). However, some of the estimated coefficients do not maintain their significance.
Table 5 Meta-regression with studies reporting a significant and negative effect
| COEFFICIENT | STANDARD ERROR | |
| Developing countries | -0.756*** | 0.226 |
| Decade of 2010 | -0.372 | 0.424 |
| Decade of 2000 | 0.445 | 0.304 |
| Climatological | 0.136 | 0.163 |
| Hydrological | 0.121 | 0.171 |
| Meteorological | 1.126*** | 0.214 |
| Geophysical | -1.247*** | 0.292 |
| Single disaster | 0.160 | 0.215 |
| EM-DAT | 0.126 | 0.297 |
| Panel data | 0.424 | 0.300 |
| Dynamic model | -0.172 | 0.248 |
| Time fixed effects | -1.608*** | 0.221 |
| Idiosyncratic fixed effects | 0.074 | 0.220 |
| Published in journal | 1.379*** | 0.268 |
| Disaster severity | 0.044 | 0.061 |
| Environ. and geography. controls | -0.157 | 0.175 |
| International trade controls | -0.154 | 0.206 |
| Human capital controls | -0.118 | 0.223 |
| Initial GDP controls | -0.017 | 0.212 |
| Financial market development controls | 0.317 | 0.210 |
| Institutional controls | -0.265 | 0.314 |
| Endogeneity controls | 0.327 | 0.308 |
| N | 412 | |
| R2 | 49.42% | |
| I2 | 98.92% |
Source: own elaboration
Note: * significant at 10%, ** significant at 5%, *** significant at 1%
In this case, the greatest negative effect for developing countries is accentuated. The lowest effects for meteorological disasters and estimates from published studies are also maintained -this is contrary to the idea of publication bias. Geophysical disasters, meanwhile, now appear with a greater negative effect than other types of disasters.
Conclusions
In a context where empirical estimates are characterized by reporting conflicting results, this work attempted to synthesize recent empirical evidence regarding the impact that the occurrence of natural disasters has on economic growth. For this, 681 point estimates from 19 studies published between 2015-2020 were considered.
The results of the meta-analysis confirm the existence of a significant and negative combined effect. That is, the occurrence of a natural disaster significantly reduces the economic growth of the affected economy. Thus, this work contributes to increasing confidence in the existence and direction of this effect.
When exploring the sources of heterogeneity between studies, it was observed that developing countries are particularly exposed to the negative effects of the occurrence of disasters. The effects of the disasters that occurred in the last decade are presented as more negative than those corresponding to previous decades. Some methodological decisions in the estimation strategies used also generate significant differences: the use of the EM-DAT records, the inclusion of fixed effects -by observational or temporal units-, the weighting by severity of disasters and the control by aspects such as international trade, development of financial markets and endogeneity. Some of these aspects, however, are not robust when considering only the subgroup of studies whose individual effect is negative and significant.
The results reported here show positive point estimates -although not significantfor the lagged effects of the occurrence of natural disasters on growth. Exploring the effect of disasters beyond the short term (more than a year after their occurrence) is especially complex considering that only 31% of all point estimates refer to lagged effects. Thus, although there is a negative effect in the short term, more evidence is necessary to achieve robust estimates regarding persistence in the medium and long term. In the future, it is desirable to also have intra-annual estimates that allow identifying the impact of disasters in periods of less than a year.
Considering that in the future an increase in the frequency and severity of the occurrence of natural disasters is expected, the results of this work constitute a clear call for attention towards an active implementation of public policies for mitigation and adaptation. This is especially true for developing countries where the evidence agrees to highlight that the negative effects of natural disasters are greater, including long-lasting effects on human development and a higher mortality risk (González et al., 2020; 2021b). Thus, the implementation of these policies not only contributes to reducing vulnerability to disasters, but also constitutes true tools to combat poverty on a global scale.