


 nueva página del texto (beta)
 Español (pdf)
 Artículo en XML
 Referencias del artículo
 Enviar artículo por email
 Citado por SciELO
  Similares en
SciELO
Similares en
SciELO 
 Permalink
Introducción
The most commercialized flour is wheat flour, however, in the last decade, studies have been carried out to determine physical-chemical and tecnofunctional properties of different sources for the generation of flours such as tubers, legumes, pseudo-cereals, some fruits and vegetables, among others (Ferreira et al., 2013; Gostin, 2019; Kui et al., 2014). These studies have shown that different raw materials have physicochemical and functional properties that make them attractive and have great potential for the food industry such as high protein and fiber content or good water and oil absorption.
Flour plays an important role in the food industry, as it is the basis to produce various foods such as bread, yeast-free baked goods, pasta, extruded sandwiches, among others. Therefore, understanding and knowledge of the chemical composition, physicochemical and functional properties of flours are essential to determine their viability of use and application in specific food products (Kraithong et al., 2018; Wang et al., 2020).
Among the options for obtaining raw materials for the generation of functional flours, we can find different agro-industrial waste, which in addition to having the potential to generate value-added products, contribute to the reduction of its impact on the environment. For example, coffee is one of the most commercialized products worldwide, however more than 50% of the fruit is discarded and is generally considered as a waste that is discharged without proper treatment, which can become a serious environmental pollution problem, since it increases the oxygen demand for its degradation due to the high amounts of organic matter that they represent (Benitez et al., 2019; Esquivel & Jiménez, 2012; Mussato et al., 2011).
The husk, pulp, parchment, silver husk and ground coffee represent at least 90% of the total waste produced during the coffee production chain (Iriondo-DeHond et al., 2019). The coffee husk is the outer skin with a characteristic hard structure that is obtained by separating the silver skin from the coffee and that is rich in caffeine, tannins, pectin, polyphenols, and carbohydrates, mainly mono and disaccharides (Janissen & Huynh, 2018). Therefore, the production of a flour from the coffee husk may represent a viable way for the use of these residues produced by the coffee industry. In that sense, the objective of this work was to determine the physicochemical, functional and flow properties of a coffee husk flour to analyze its feasibility of use in food production, as well as possible limitations.
1. Materials and methods
Coffee husk flour (CHF) free of agrochemicals was provided by the company Ocelot from Veracruz, Mexico, which was sieved using a mesh size of 250 µm (number 60) and was stored at room temperature in an airtight container for later use. Coffee husk of Coffea arabica variety was obtained from parchment during the production of coffee green beans by dry process of coffee fruit.
1. 1. Determination of chemical composition
Physicochemical properties as moisture (925.10), ashes (923.03), proteins (920.87, N x 6.25), crude fiber (978.10), titratable acidity (942.15) and fats (922.06) were determined according to the official methods established by the Association of Official Analytical Chemists (AOAC, 2000). Reducing sugars were determined by Miller method.
1. 2. Determination of functional properties
1. 2. 1. Water Holding Capacity (WHC)
The determination of water holding capacity was carried out according to the methodology established by Ateş and Emalci (2018) with modifications. First, 1g of sample was placed in a centrifuge tube and added 10 mL of distilled water; it was vortexed for 2 min at 1 800 rpm and allowed at room temperature for 30 min. Then, it was centrifuged at 3 000 rpm for 25 min, the supernatant was decanted, removing excess water. Water holding capacity was reported as grams of water absorbed per gram of dry sample.
1. 2. 2. Oil Holding Capacity (OHC)
The oil holding capacity was determined following the methodology established by Kraithong et al. (2018). 1 g of sample was weighed and mixed with 10 mL of soybean oil; subsequently, it was centrifuged at 4 000 rpm for 20 min, decanted oil and weighed the sample. Values were expressed as grams of oil absorbed per gram of dry sample.
1. 2. 3. Solubility Index (SI) and Swelling Capacity (SC)
The solubility index and the swelling capacity were determined by the methodology established by Zhu & He (2020) with some modifications. A sample of flour (0.15 g) was dissolved in 10 mL of distilled water and placed in a bath at 70 °C for 30 min, stirring periodically, after that, it was cooled at room temperature and was transferred into centrifuge tubes, which were previously weighed, and then it was centrifuged for 30 min at 3 000 rpm at room temperature. The supernatant was decanted into evaporation trays of known weight, and the pellet was weighed. To determine the mass of the dissolved solids in the supernatant, it was placed in an oven at 60 °C for 24 h. The solubility index and swelling capacity were determined using equations 1 and 2.
Where W 1 is the mass of the dry supernatant, W 0 is the mass of the flour; W s is the mass of the solid material and the remaining gel that adheres to the walls of the centrifuge tube.
1. 2. 4. Hygroscopicity
Hygroscopicity was determined with the method established by Islam et al. (2017). A sample (0.25 g) was weighed and placed in a desiccator with a saturated solution of NaCl (75.29% RH). Weighed the sample after one week, and the hygroscopicity was determined as the mass of hygroscopic moisture per 100 g of dry solid.
1. 2. 5. Viscosity
The viscosity of CHF was determined using the methodology established by Li et al. (2019) with some modifications. A 13% w/w flour suspension was prepared and placed on the rheometer plate (AR2000ex rheometer, 60 mm parallel plates.) with a 1mm plate spacing. A frequency sweep was performed from 0.1 to 10 Hz at 25 °C and at a constant voltage of 0.2 per cent.
1. 3. Determination of flow properties
1. 3. 1. Apparent density
Apparent density was determined according to FEUM (2014). 1g of sample was weighed and allowed to flow into a 10 ml graduated cylinder, recording the sample volume occupied in mL, the density was calculated with equation 3.
Where is the apparent density, m is the mass of the flour and v the volume occupied by the flour.
1. 3. 2. Compacted density
The determination of the compacted density was carried out according to FEUM (2014) with some modifications. 1 g of sample was weighed and poured into a 10 mL graduated cylinder, then the “tapping” was carried out, which consisted of raising the cylinder to a height of 10 cm and returning it to the surface, repeating this 250 times, recording the final volume occupied. Finally, compacted density was calculated using equation 4.
Where ρc is the compacted density, m is the mass of the sample and vc is the compacted volume.
1. 3. 3. Particle density
Particle density is the mass of the solid fraction divided by the volume it occupies, excluding the intergranular spaces (Ambrose et al., 2015). The determination of particle density was carried out as established by Jinapong et al. (2008). 1 g of flour was placed in a 10 mL measuring cylinder; subsequently, 5 mL of petroleum ether was added and mixed with 1mL more of ether to wash the walls of the cylinder. The particle density was determined using equation 5.
1. 3. 4. Hausner Index (HI)
Hausner index is an indicator of fluidity and determines the degree of cohesiveness of powders. HI values >1.4 indicate high cohesiveness, values between 1.2 and 1.4 indicate an intermediate cohesiveness and, values < 1.2 indicate low cohesiveness (Islam et al., 2017). Hausner index was calculated using equation 6.
Where is the packed density and is the bulk density.
1. 3. 5. Compressibility Index (CI)
Compressibility index or Car index is an indicator of flowability that determines how prone a powder is to be compressed (Ambrose et al., 2015). Compressibility values <15, 15-20, 20-35, 35-45 and >45% represent excellent, good, intermediate, little and very little fluidity, respectively (Islam et al., 2017). The Car index was calculated with equation 7.
Where is the packed density and is the bulk density.
1. 3. 6. Angle of repose
The angle of repose was determined following the method established by Bian et al. (2015) with some modifications. A 30 g sample was taken and sieved to eliminate any possible agglomerations that could form, after that, a funnel was placed in universal support at a height of 12.5 cm with respect to the base. The sample was allowed to flow through the funnel and the diameter of the cone formed as well as the height was measured. It was used equation 8 to determine the angle of repose.
Where θ is the repose angle, h is the height of the cone formed, d the diameter of the base of the cone.
1. 3. 7. Porosity
Porosity was determined according to Islam et al. (2017) and it was calculated using equation 9.
Where ε is the porosity, ρp the density of the particle and ρc the compacted density.
2. Results and discussion
2. 1. Coffee husk flour chemical composition
Table 1 shows the chemical composition of coffee husk flour, where the values of crude fiber, proteins, ash, lipids, moisture content, reducing sugars and acidity are showed. Fiber crude and proteins of CHF were lower with respect to the coffee pulp flour elaborated by Ramirez & Jaramillo (2015) (fiber 18.1% and protein 10.5%); however, protein values were like those of Iriondo-DeHond et al. (2019), who reported 8.4% of proteins in coffee husk flour.
Table 1 Chemical composition of CHF
| Chemical component | Composition (g/100g d.s.) |
| Moisture content | 8.97 ± 0.05 |
| Proteins | 8.30 ± 0.31 |
| Crude fiber | 13.94 ± 1.97 |
| Ash | 7.86 ± 1.08 |
| Lipids | 1.46 ± 0.01 |
| Reducing sugars | 12.39 ± 0.39 |
| Titratable acidity (g citric acid) | 1.70 ± 0.073 |
Note:The data are presented as mean ± SD (n = 3).
Fuente: own elaboration.
Brand et al. (2000) reported 6.6 g/100 g d.s. for coffee husk, this value is lower than the determined in this work, which can be due to various factors such as the climate and the type of soil where coffee fruit grows, as well as the processing method used to produce flour.
The moisture content of coffee husk flour was 8.97 g/100 g d.s., this is lower than the value established by the Official Mexican Standard NOM-247-SSA1-2008 (SEGOB, 2009) for wheat flour and other types of cereals (15%), which implies a lower growth of microorganisms and slower development of deterioration reactions. Higher moisture content can cause difficulties during handling and transport in the flour production and storage chain. On the other hand, it can generate undesirable effects such as spoilage due to microbial growth, the formation of agglomerates or caking can be generated and consequently, the quality of the product can be affected (Barbosa-Cánovas & Yan, 2003).
Regarding lipids and ash, the data of coffee husk flour elaborated in this work (1.46 g/100 g d.s. and 7.86 g/100 g d.s., respectively) were close to those of Ramirez & Jaramillo (2015), who reported 1.63% of lipids and 8.2% of ashes for coffee pulp flour. Iriondo-DeHond et al., 2019 reported 2.7% of lipids in a coffee husk. The low amount of lipids present in coffee husk flour represent something desirable since it reduces the possibility of undesirable flavors and odors caused by rancidity. However, coffee husk flour had a higher ash content (7.86% w/w) than silver skin (5.36% w/w) and spent coffee (1.30% w/w), which was reported by Ballesteros et al. (2014). A higher amount of ash represents a higher mineral content, therefore a major amount of minerals present in the CHF can be consumed. About it, around 50 minerals present in different concentrations have been detected in the coffee fruit (Marino, 2019). Heuzé & Tran (2015) reported the presence of manganese, copper, zinc, calcium, potassium, sodium, phosphorus, and magnesium in the coffee husk, some of these minerals are considered essential.
Coffee husk flour presented a greater amount of protein (8.30 g/100 g s. s.) than the other flours used to replace wheat flour, in this regard, Li et al. (2019) reported 0.98 g/100 g for yam flour and Yuksel et al. (2022) reported 6.9 g/100 g for corn and potatoes flour. Reducing sugars and titrrable acidity present in the coffee flour (12.39 g/100 g d.s. and 1.7 g citric acid/100 g d. s., respectively) were higher that the value for the coffee bean, according to Arya et al. (2022). It is known that reducing sugars and acidity are responsible for providing flavor, aroma and color in coffee and can impact the taste and smell of the foods. They can act as indicators of the state of conservation of the flour since they can generate deterioration reactions during storage (Huang et al., 2020). If the acidity values are higher and the reducing sugar are lower, in that case, it can be associated with a possible fermentation which in turn could cause undesirable flavors in the flour. The differences between the composition of the flour analyzed in this work with other flours from similar sources are due to factors such as the species and variety of the fruit, the edaphic and climatic conditions, the treatment to produce the flour as reported by Kui et al. (2014).
2. 2. Functional properties
2. 2. 1. Oil holding capacity and water holding capacity
Oil Holding Capacity (OHC) and water holding capacity (WHC) for coffee husk flour are shown in table 2. WHC was 2.41 g water/g d.s., which is very close to WHC of parchment (2.6 mL/g), although it is lower than those for silver skin and spent coffee (5.11 g water/g d.s. and 5.73 g water/g d.s., respectively) reported by Ballesteros et al. (2014). Water and oil holding capacity can be defined as the ability of the flour to retain water or oil physically, capillary and hydrodynamically after a centrifuge force is applied. It is known that fiber is associated with the ability to retain water and oil when incorporated to certain foods (Ateş & Emalci, 2018). In this case, fiber is one of the components of the coffee husk and other by-products of coffee (silver skin and spent coffee), so the differences of WHC among the by-products of coffee, can be associated with the composition of each residue. Also, factors such as the content and distribution of polysaccharides in the cell wall affect the hydration properties (Benitez et al., 2019). One of the desirable polysaccharide in the CHF is the coffee mucilage, which can provoke beneficial effects on the body because it is a soluble fiber.
Lipids play an important role regarding the sensory quality of food since they help to improve flavors and obtain softer products, improving palatability. Oil holding capacity can be influenced by factors such as particle size, charge density, as well as the surface availability of the hydrophobic nonpolar side chains of its constituent components, such as some insoluble fibers and, it can be related to the action of capillary forces (Kui et al., 2014; Ballesteros et al., 2014; Benitez et al., 2019). Oil holding capacity of the coffee husk flour was 1.37 g oil/g d. s., this is very close to that reported by Kraithong et al. (2018) for Thai organic rice flour (1.11-1.34 g/g), as well as that reported by Kui et al. (2014) for black bean flour (1.38 g oil/g). Gouw et al. (2017) mentioned that the oil absorption capacity values of some flour fruits and vegetables is less than 2 g oil/g d.s. such as mangoes (0.94 g/g sample), apple (1.48 g oil/g d. s.), blueberry (1.96 g oil/g d. s.) and raspberry (1.13 g oil/g d. s.) (Ferreira et al., 2013; Gouw et al., 2017).
2. 2. 2. Solubility index, swelling capacity and hygroscopicity
As shown in table 2, the solubility index of the coffee husk flour analyzed was 44.77%. The solubility index refers to the solubility of flour in water. This value can be related to the nature of the matter from which it is obtained. The solubility of the flour was higher than that reported for Thai rice flour (2.97-7.05%) (Kraithong et al., 2018) as well as legume flours (19.44 - 29.14 g/100g) (Kui et al., 2014). High solubility values in polysaccharides may be related to the ability to thicken or to form gels (Lovegrove et al., 2017). Some polysaccharides present in the cell wall of plant tissues have charged groups that interact with polar molecules such as water, which can favor their solubility.
Table 2 Functional properties of CHF
| Parameter | Results |
| Water Holding Capacity (g water/g d.s.) | 2.41 ± 0.05 |
| Oil Holding Capacity (g oil/g d.s.) | 1.37 ± 0.01 |
| Solubility Index (%) | 44.70 ± 0.96 |
| Swelling Capacity (g/g d.s) | 9.72 ± 0.64 |
| Hygroscopicity (g/100 g d.s.) | 16.23 ±0.18 |
Note:The data are presented as mean ± SD (n = 3).
Fuente: own elaboration.
Iriondo-DeHond et al. (2019) carried out a separation and characterization of soluble solids from coffee husk flour, they reported the presence of 5-caffeoylquinic acid, caffeine, antioxidant, flavonoids, and phenolic compounds as well as some water-soluble sugars, so these functional compounds represent part of the fraction of soluble solids of coffee husk, which is beneficial in the food production if this flour is added to these. Also, the high solubility compared to other conventional flours can influence positively the interfacial functional properties (emulsification and foaming), this would be desirable in some bakery products and shakes (Foschia et al., 2017).
The coffee husk flour showed a swelling capacity of 9.72 g/g d. s. (table 2), these values can be due to the fiber content present, since, as it is known, one of the main characteristics of dietary fiber is the ability to swell. Yeh et al. (2005) mentioned that the fibers tend to form a hydrophilic matrix, where water is trapped, filling the interstices of the quasicrystalline polysaccharide, and thus causing significant swelling. Swelling capacity of CFH (9.72 g/g d.s.) was higher than that reported for some fruits (mangoes, apple, blueberries, and raspberry) since these were between the range of 1.45 to 6.51 mL/g (Ferreira et al., 2013; Gouw et al., 2017).
The hygroscopicity of coffee husk flour was 16.23 g water/100 g d.s. (table 2), this value is higher than that reported by Islam et al. (2017) for orange juice powder, who reported 7.14 g water/100 g d.s. High hygroscopicity of the powders tends to be a problem since the increase in the humidity of these is related to the increase in the cohesiveness, giving rise to the formation of caking and development of others deterioration reactions. Water molecules show an ability to form hydrogen bond networks, as well as ion-dipole interactions, which allow them to establish interactions with other polar molecules. The exposure of hydroxyl groups by the food system allows interaction with water molecules in the environment, showing hygroscopic behavior. This moisture transfer occurs when there is a gradient between the relative humidity (RH) of environment and the water activity of the food. Therefore, optimal storage conditions must be established to guarantee the quality of the product (Acosta-Domínguez et al., 2018).
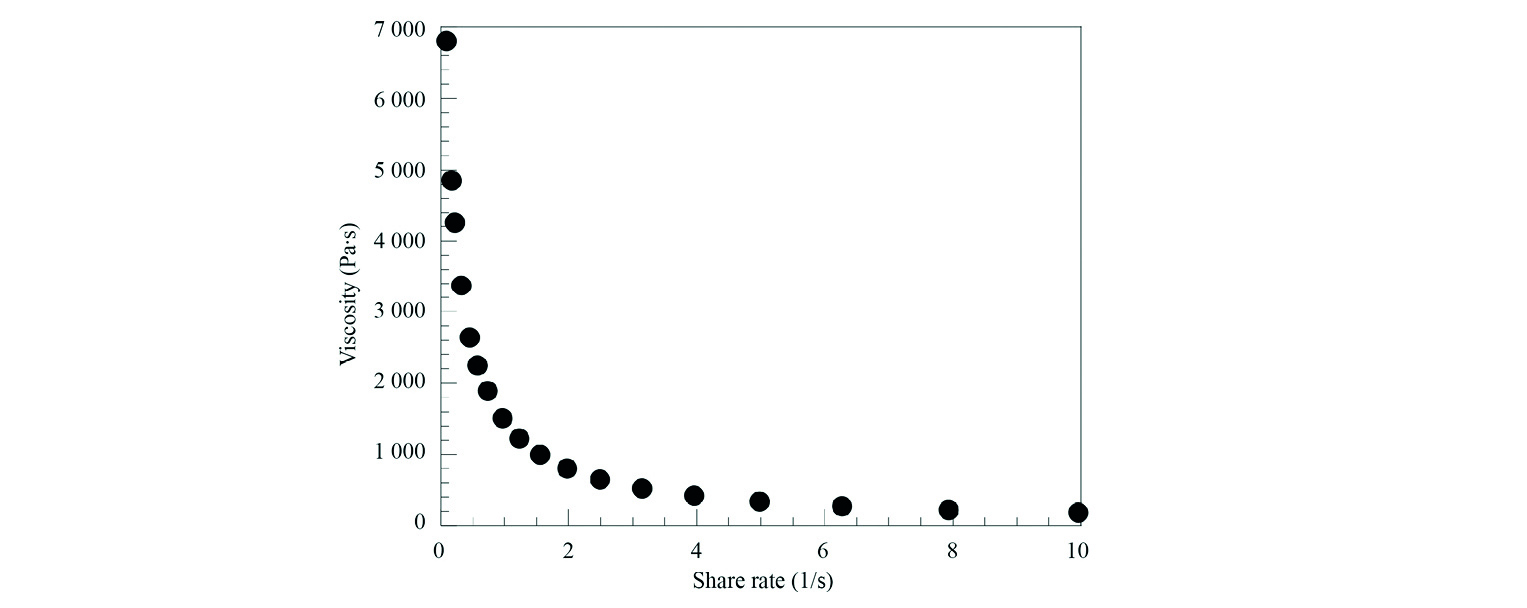
2. 2. 3. Viscosity
Figure 1 shows the viscosity curve of coffee husk flour in a shear rate range of 0.1 to 10 rps at 25 °C. The behavior of viscosity is a representative curve of pseudoplastic fluids since this is characterized by a decrease in viscosity as the shear rate increases, which is due to the reduction of friction between the layers, similar results had Li et al. (2019), who reported a decrease in viscosity with the increase of frequency in yam doughs. The viscosity of the flour suspension presented a viscosity range from 6797 to 171.6 Pa·s at 25 °C in the share rate range from 0.1 to 10 rps. The viscosity of CFH was higher than the viscosity reported by Li & Zhu (2019) for kiwi fruit flour, who reported a maximum viscosity value of 2.6 Pa·s for cold kiwi fruit paste. Also, the viscosity of CFH was higher than the viscosity reported by Li et al. (2019) for yam doughs, who reported values from 150 to 10 Pa·s. In this regard, Lovegrove et al. (2017) point out that a high concentration of non-starchy polysaccharides increases the viscosity, so the high content of fiber in CFH causes an increase in its viscosity in the treated conditions.
2. 3. Flow properties
2. 3. 1. Particle size and density
Table 3 shows particle size and density of the coffee husk flour. Particle size of coffee husk flour was ≤250 µm, this value was very similar to that reported for rice flour and parchment. The physical properties, such as the geometry, size and surface characteristics of the individual particles and the type of food system are factors that can affect the flow and functional properties of food powders. Decreasing the particle size causes an increase in the interparticle forces, so the powder becomes more cohesive, hindering its ability to flow (Ambrose et al., 2015), also, decreasing the particle size causes an increase in the contact area between the particles, which can influence functional properties such as CRA and CAA (Ballesteros et al., 2014).
Density is an important physical property to consider during the transport and handling of powders. There are 3 types of densities, which are bulk or apparent density, tapped or compacted density and particle density. Bulk tapped and particle density of coffee husk flour was 0.39 g/mL, 0.56 g/mL, and 1.34g/mL, respectively.
The bulk density of coffee husk flour (0.39 g/mL) was lower than other flours such as rice (0.57-0.73 g/mL), parchment (0.7 g/mL), and wheat (0.553-0.658 g/mL) (Kraithong et al., 2018; Benitez et al., 2019; Bian et al., 2015). Low values in the bulk density may be desirable in the elaboration of products with soft and dense textures (Kraithong et al., 2018).
2. 3. 2. Porosity, angle of repose, compressibility, and Hausner index
During the production chain, the flours can have physical changes such as compaction or agglomerations, which can affect their flow capacity, causing problems during their handling and transport, so, for that reason, it is important the determination of the flow properties, principally. Table 4 shows porosity, angle of repose, compressibility, and Hausner index of coffee husk flour. The relationship between bulk density and compacted density is known as the Hausner index (HI), which was 1.41 for CHF, so this indicates a type of poor flow; on the other hand, the compressibility index (CI) presented a value of 29.3, which suggests an intermediate fluency based on the scale presented by Islam et al. (2017). Hygroscopic powders tend to present high HI and CI values (Islam et al., 2017), as HI and CI increase, the powder tends to be more cohesive and therefore its fluidity decrease. Also, a powder is more cohesive, and its compressibility will be higher when the apparent density is lower. The main interparticular forces given in the system that affect the fluidity of the powders are the hydrogen bridges and the Van der Waals forces (Ambrose et al., 2015). The angle of repose can reflect the friction existing in the sample; the analyzed flour presented an angle of repose value of 33.39°, which means it has an acceptable flow, according to the scale presented by Ambrose et al. (2015). Porosity represents the aeration capacity of bulk solids; porosity of the analyzed flour was 54.02%, which may mean that there is a greater possibility of aeration. Small porosity values can mean lower oxygen permeability, which means a lower risk of component oxidation (Islam et al., 2017).
Prospective analysis
The knowledge of chemical composition, functional and flow properties of the flours is very important for the determination of its final application in the food industry. Physicochemical and functional properties are involved in the process, conservation and quality control of the foods product, however all of these properties change when are used or added new ingredients in the food formulations, so it is always necessary to analyze the properties before and after adding the new ingredients. On the other hand, the flow properties can be an indicator of the volume of packaging material, but it is important to highlight that the data shown were used for the preliminary characterization of the flow of coffee flour husk and used as flow indicators, however, for the application in the design of equipment, dynamic study data are required where the powders are brought to conditions simulated processing, handling, and storage (Bian et al., 2015).
Conclusions
The composition of coffee husk flour represented a great source of crude fiber and protein and showed a high value of ash compared to other fruits flours, therefore, if it is used as an ingredient in new formulations of food products it could show benefits in the people’s diet.
Coffee husk flour has good functional properties such as a higher swelling capacity and viscosity than other types of fruit flours due to its high fiber content, properties that could be used as a thickener in products such as sauces, smoothies, or dressings and also, coffee husk flour could be added in the dough of bakery foods such as cookies, breads, brownies, and products where the formation of a gluten network is not desired. The results of flow properties and the hygroscopicity of coffee husk flour suggest that it is necessary to store it in a low humidity environment to decrease the spoilage reactions and avoid caking of this, as well as use airtight packaging that prevent gas exchange.

