Sensitivity analysis helps to understand the behavior of a model, the coherence between the model and the real world, it also analyzes how the different parts of the model interact, as well as the great variety of problematic configurations that can be found in the model. sensitivity analysis studies, (Saltelli & Scott 1997).
The sensitivity analysis illustrates the variation of the value or result of a model in response to changes in some of its key variables, keeping the value of the other variables constant. The sensitivity analysis is carried out considering one variable at a time and always assuming that there is independence between the different variables that influence or determine the value in the model.
The first step in performing a sensitivity analysis is to identify the main variables that affect the value or result of a model, always considering that these variables are out of our control or that they could be estimated imprecisely, immediately, for each one of the variables, positive and negative scenarios that are reasonable and well-founded must be sought. Finally, the value for each of the scenarios is determined or calculated.
In the sensitivity analysis, two different schools of thought are identified, the “Global” and the “Local”, Saltelli and others (1999):
In the local analysis, the response obtained from the outputs, by varying the put factors one at a time, is inverted, while keeping the others fixed at a central (nominal) value. These are partial derivatives, normalized by the nominal value of the factor or by its standard deviation. The analysis is executed in a central point, given in the space of the input factors, the volume of the explored region is null.
In the global school, sensitivity analysis is more ambitious in two respects: first, the space of input factors is explored within a finite (or even infinite) region, and second, the induced output variation for a factor is taken globally, that is, it is averaged over the variation of all the factors.
The local sensitivity school has generated impressive results, especially for the treatment of large systems of differential and adjoint equations by the group, (Cacuci, 1981; Oblow et al. 1986).
Sensitivity analysis is one of the most used tools by project managers to analyze, predict and present the expected results of a project to potential investors or stakeholders. Among the multiple benefits of applying sensitivity models in project management, the following are mentioned:
Decision making. Sensitivity analysis facilitates business planning and decision making because of data-backed forecasts. Investment decisions by management are made easier by considering all the variables and analyzing their multiple results.
Quality control. The sensitivity analysis allows identifying the processes that are not generating value in the product, it allows reducing the time in the elaboration of the product, it allows identifying errors early and it facilitates the generation of greater diversification.
Allocation of resources. Sensitivity analysis allows you to identify the strengths and weaknesses in the planning of a project, while measuring its possible impact on the results. This allows organizations to direct tangible and intangible resources to the areas that most need support.
Sensitivity analysis focused on financial aspects allows us to identify and visualize what effects would be had on an investment if certain events were to occur that we had not initially foreseen, for example, what would happen if economic growth is lower than forecast? A financial crisis occurs. How would the current scenario be affected? How is the cash flow affected? How is the NPV affected? Where does the project stop be profitable? Etc. These and many other questions are answered with the support of a sensitivity analysis.
Predicting the behavior of the variables and the results of the possible scenarios through a sensitivity analysis allows the directors of the organizations to make better decisions regarding the business in general and future investments in new projects.
Financial indicators are useful as measures of performance, charting long-term direction and proposing a clear strategy and proper execution.
Next, the evolution of some economic and financial indicators of the Mexican environment is described and shown to facilitate decision-making related to personal and business strategies in an integral manner.
National Consumer Price Index (INPC, Spanish)
The Price and Quotation Index of the Mexican Stock Exchange (IPC, Spanish)
Exchange rate
Equilibrium interbank interest rate (TIIE, Spanish)
CETES rate of return
Investment units (UDIS, Spanish)
1.NATIONAL CONSUMER PRICE INDEX (INPC)
Born in 1995 and reflecting changes in consumer prices, measures the general increase in prices in the country. It is calculated fortnightly by the Bank of Mexico and INEGI (2021). INPC is published in the Official Gazette of the Federation on the 10th and 25th of each month. The reference period is the second half of December 2010.
Table 1 Accumulated inflation in the year (Base: 2nd. Fortnight of December 2010 = 100 with data provided by Banco de México)
| Periodo | 2010 | 2011 | 2012 | 2013 | 2014 | 2015 | 2016 | 2017 | 2018 | 2019 | 2020 | 2021 | 2022 |
| Enero | 1.48 | 0.77 | 0.98 | 0.79 | 0.90 | -0.09 | 0.38 | 1.70 | 0.53 | 0.09 | 0.48 | 0.86 | 0.59 |
| Febrero | 2.15 | 1.42 | 1.47 | 1.46 | 1.15 | 0.09 | 0.82 | 2.29 | 0.91 | 0.06 | 0.90 | 1.50 | 1.43 |
| Marzo | 2.52 | 1.84 | 1.55 | 1.99 | 1.43 | 0.51 | 0.97 | 2.92 | 1.24 | 0.44 | 0.85 | 2.34 | 2.43 |
| Abril | 1.98 | 0.72 | 0.69 | 1.81 | 1.24 | 0.25 | 0.65 | 3.04 | 0.90 | 0.50 | -0.17 | 2.67 | 2.98 |
| Mayo | 0.60 | -0.70 | -0.65 | 0.95 | 0.91 | -0.26 | 0.20 | 2.92 | 0.73 | 0.21 | 0.22 | 2.88 | 3.17 |
| Junio | 0.49 | -0.41 | -0.41 | 1.12 | 1.09 | -0.09 | 0.31 | 3.18 | 1.12 | 0.27 | 0.76 | 3.43 | 4.04 |
| Julio | 0.56 | -0.04 | 0.32 | 1.14 | 1.42 | 0.06 | 0.57 | 3.57 | 1.66 | 0.65 | 1.43 | 4.04 | 4.80 |
| Agosto | 0.91 | 0.30 | 0.92 | 1.31 | 1.73 | 0.27 | 0.86 | 4.08 | 2.26 | 0.63 | 1.82 | 4.24 | |
| Septiembre | 1.27 | 0.73 | 1.12 | 1.61 | 2.18 | 0.27 | 1.47 | 4.41 | 2.69 | 0.89 | 2.06 | 4.88 | |
| Octubre | 2.35 | 2.33 | 2.12 | 2.77 | 2.74 | 1.16 | 2.09 | 5.06 | 3.22 | 1.44 | 2.68 | 5.76 | |
| Noviembre | 3.89 | 4.87 | 3.86 | 4.57 | 3.57 | 1.71 | 2.89 | 6.15 | 4.10 | 2.26 | 2.76 | 6.97 | |
| Diciembre | 4.19 | 5.81 | 3.97 | 5.21 | 4.08 | 2.13 | 3.36 | 6.77 | 4.83 | 2.83 | 3.15 | 7.36 |
Source: Own elaboration (INEGI, 2022). Route: Indicadores económicos de coyuntura > Índices de precios > Índice nacional de precios al consumidor. Base segunda quincena de julio de 2018=100 > Mensual > Índice > Índice general
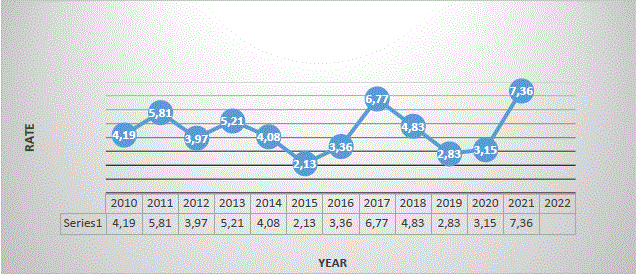
Source: Own elaboration (INEGI, 2022). Route: Indicadores económicos de coyuntura > Índices de precios > Índice nacional de precios al consumidor. Base segunda quincena de julio de 2018=100 > Mensual > Índice > Índice general
Graph 1 Inflation in Mexico (2010-2021 accumulated at the end of the year)

Source: Own elaboration (INEGI, 2022). Route: Indicadores económicos de coyuntura > Índices de precios > Índice nacional de precios al consumidor. Base segunda quincena de julio de 2018=100 > Mensual > Índice > Índice general
Graph 2 Inflation in Mexico (accumulated January-July 2022)
2.THE PRICE AND QUOTATION INDEX OF THE MEXICAN STOCK EXCHANGE (IPC)
Represents the change in the values traded on the Mexican Stock Exchange concerning the previous day to determine the percentage of rising or fall of the most representative shares of the companies listed therein.
Table 2 The Price and Quotation Index of the Mexican Stock Exchange (Base: October 1978, 0.78=100)
| Periodo | 2011 | 2012 | 2013 | 2014 | 2015 | 2016 | 2017 | 2018 | 2019 | 2020 | 2021 | 2022 |
| Enero | 36,982 | 37,422 | 45,278 | 40,879 | 40,951 | 43,631 | 47,001 | 50,456 | 43,988 | 44,862 | 42,986 | 51,331 |
| Febrero | 37,020 | 37,816 | 44,121 | 38,783 | 44,190 | 43,715 | 46,857 | 47,438 | 42,824 | 41,324 | 44,593 | 53,401 |
| Marzo | 37,441 | 39,521 | 44,077 | 40,462 | 43,725 | 45,881 | 48,542 | 46,125 | 43,281 | 34,554 | 47,246 | 56,537 |
| Abril | 36,963 | 39,461 | 42,263 | 40,712 | 44,582 | 45,785 | 49,261 | 48,354 | 44,597 | 36,470 | 48,010 | 51,418 |
| Mayo | 35,833 | 37,872 | 41,588 | 41,363 | 44,704 | 45,459 | 48,788 | 44,663 | 42,749 | 36,122 | 50,886 | 51,753 |
| Junio | 36,558 | 40,199 | 40,623 | 42,737 | 45,054 | 45,966 | 49,857 | 47,663 | 43,161 | 37,716 | 50,290 | 47,524 |
| Julio | 35,999 | 40,704 | 40,838 | 43,818 | 44,753 | 46,661 | 51,012 | 49,698 | 40,863 | 37,020 | 50,868 | 48,144 |
| Agosto | 35,721 | 39,422 | 39,492 | 45,628 | 43,722 | 47,541 | 51,210 | 49,548 | 42,623 | 36,841 | 53,305 | 44,919 |
| Sep. | 33,503 | 40,867 | 40,185 | 44,986 | 42,633 | 47,246 | 50,346 | 49,504 | 43,011 | 37,459 | 51,386 | |
| Oct. | 36,160 | 41,620 | 41,039 | 45,028 | 44,543 | 48,009 | 48,626 | 43,943 | 43,337 | 36,988 | 51,310 | |
| Nov. | 36,829 | 41,834 | 42,499 | 44,190 | 43,419 | 45,286 | 47,092 | 41,733 | 42,820 | 41,779 | 49,699 | |
| Dic. | 37,077 | 43,706 | 42,727 | 43,146 | 42,998 | 45,643 | 49,354 | 41,640 | 43,541 | 44,067 | 53,272 |
Source: Own elaboration (BANXICO, 2022). https://www.banxico.org.mx/SieInternet/consultarDirectorioInternetAction.do?sector=7&accion=consultarCuadro&idCuadro=CF57&locale=es
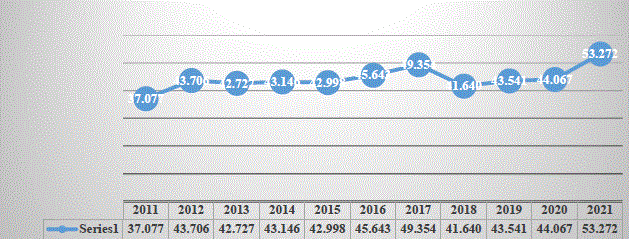
Source: Own elaboration (BANXICO, 2022). https://www.banxico.org.mx/SieInternet/consultarDirectorioInternetAction.do?sector=7&accion=consultarCuadro&idCuadro=CF57&locale=es
Graph 3 The Price and Quotation Index of the Mexican Stock Exchange, 2010 - 2021 (Score at the end of each year)

Source: Own elaboration (BANXICO, 2022). https://www.banxico.org.mx/SieInternet/consultarDirectorioInternetAction.do?sector=7&accion=consultarCuadro&idCuadro=CF57&locale=es
Graph 4 The Price and Quotation Index of the Mexican Stock Exchange, January-August 2022 (Score at the end of each month)
3.EXCHANGE RATE
It is the value of the Mexican peso with respect to the dollar calculated with the daily average of the five most important banks in the country, which reflects the spot price (cash), negotiated between banks. It is highly related to Inflation, the interest rate, and the Mexican Stock Exchange.
Table 3 Exchange rate (National currency per US dollar, parity at the end of each period)
| Periodo | 2010 | 2011 | 2012 | 2013 | 2014 | 2015 | 2016 | 2017 | 2018 | 2019 | 2020 | 2021 | 2022 |
| Enero | 12.81 | 12.02 | 12.95 | 12.71 | 13.37 | 14.69 | 18.45 | 21.02 | 18.62 | 19.04 | 18.91 | 20.22 | 20.74 |
| Febrero | 12.96 | 12.17 | 12.87 | 12.87 | 13.30 | 14.92 | 18.17 | 19.83 | 18.65 | 19.26 | 19.78 | 20.94 | 20.65 |
| Marzo | 12.61 | 11.97 | 12.80 | 12.36 | 13.08 | 15.15 | 17.40 | 18.81 | 18.33 | 19.38 | 23.48 | 20.44 | 19.99 |
| Abril | 12.24 | 11.59 | 13.20 | 12.16 | 13.14 | 15.22 | 19.40 | 19.11 | 18.86 | 19.01 | 23.93 | 20.18 | 20.57 |
| Mayo | 12.68 | 11.63 | 13.91 | 12.63 | 12.87 | 15.36 | 18.45 | 18.51 | 19.75 | 19.64 | 22.18 | 19.92 | 19.69 |
| Junio | 12.72 | 11.84 | 13.66 | 13.19 | 13.03 | 15.57 | 18.91 | 17.90 | 20.06 | 19.21 | 23.09 | 19.91 | 20.13 |
| Julio | 12.83 | 11.65 | 13.28 | 12.73 | 13.06 | 16.21 | 18.86 | 17.69 | 18.55 | 19.99 | 22.20 | 19.85 | 20.34 |
| Agosto | 12.73 | 12.41 | 13.27 | 13.25 | 13.08 | 16.89 | 18.58 | 17.88 | 19.07 | 20.07 | 21.89 | 20.06 | 20.09 |
| Septiembre | 12.86 | 13.42 | 12.92 | 13.01 | 13.45 | 17.01 | 19.50 | 18.13 | 18.90 | 19.68 | 22.14 | 20.56 | |
| Octubre | 12.45 | 13.20 | 13.09 | 12.89 | 13.42 | 16.45 | 18.84 | 19.15 | 19.80 | 19.16 | 21.25 | 20.53 | |
| Noviembre | 12.33 | 14.03 | 13.04 | 13.09 | 13.72 | 16.55 | 20.55 | 18.58 | 20.41 | 19.61 | 20.14 | 21.45 | |
| Diciembre | 12.40 | 13.99 | 13.01 | 13.08 | 14.72 | 17.21 | 20.73 | 19.79 | 19.68 | 18.87 | 19.91 | 20.47 |
NOTE: Exchange rate FIX by The Banco de México, used for settle obligations denominated in foreign currency. Quote at the end
Source: Own elaboration (BANXICO, 2022). https://www.banxico.org.mx/SieInternet/consultarDirectorioInternetAction.do?sector=6&accion=consultarCuadro&idCuadro=CF102&locale=es

Source: Own elaboration (BANXICO, 2022). https://www.banxico.org.mx/SieInternet/consultarDirectorioInternetAction.do?sector=6&accion=co nsultarCuadro&idCuadro=CF102&locale=es
Graph 5 Exchange rate (National currency per US dollar, 2010-2021, FIX parity at the end of each year)
4.EQUILIBRIUM INTERBANK INTEREST RATE (TIIE)
On March 23, 1995, the Bank of Mexico, to establish an interbank interest rate that better reflects market conditions, released the Interbank Equilibrium Interest Rate through the Official Gazette of the Federation.
Table 4 Equilibrium interbank interest rate (28-day quote)
| Periodo | 2010 | 2011 | 2012 | 2013 | 2014 | 2015 | 2016 | 2017 | 2018 | 2019 | 2020 | 2021 | 2022 |
| Enero | 4.91 | 4.86 | 4.79 | 4.84 | 3.78 | 3.29 | 3.56 | 6.15 | 7.66 | 8.59 | 7.50 | 4.47 | 5.72 |
| Febrero | 4.92 | 4.84 | 4.78 | 4.80 | 3.79 | 3.29 | 4.05 | 6.61 | 7.83 | 8.54 | 7.29 | 4.36 | 6.02 |
| Marzo | 4.92 | 4.84 | 4.77 | 4.35 | 3.81 | 3.30 | 4.07 | 6.68 | 7.85 | 8.51 | 6.74 | 4.28 | 6.33 |
| Abril | 4.94 | 4.85 | 4.75 | 4.33 | 3.80 | 3.30 | 4.07 | 6.89 | 7.85 | 8.50 | 6.25 | 4.28 | 6.73 |
| Mayo | 4.94 | 4.85 | 4.76 | 4.30 | 3.79 | 3.30 | 4.10 | 7.15 | 7.86 | 8.51 | 5.74 | 4.29 | 7.01 |
| Junio | 4.94 | 4.85 | 4.77 | 4.31 | 3.31 | 3.30 | 4.11 | 7.36 | 8.10 | 8.49 | 5.28 | 4.32 | 7.42 |
| Julio | 4.92 | 4.82 | 4.78 | 4.32 | 3.31 | 3.31 | 4.59 | 7.38 | 8.11 | 8.47 | 5.19 | 4.52 | 8.04 |
| Agosto | 4.90 | 4.81 | 4.79 | 4.30 | 3.30 | 3.33 | 4.60 | 7.38 | 8.10 | 8.26 | 4.76 | 4.65 | 8.50 |
| Sep. | 4.90 | 4.78 | 4.81 | 4.03 | 3.29 | 3.33 | 4.67 | 7.38 | 8.12 | 8.04 | 4.55 | 4.75 | |
| Octubre | 4.87 | 4.79 | 4.83 | 3.78 | 3.28 | 3.30 | 5.11 | 7.38 | 8.15 | 7.97 | 4.51 | 4.98 | |
| Noviembre | 4.87 | 4.80 | 4.85 | 3.80 | 3.31 | 3.32 | 5.57 | 7.39 | 8.34 | 7.78 | 4.48 | 5.13 | |
| Diciembre | 4.89 | 4.79 | 4.85 | 3.79 | 3.31 | 3.55 | 6.11 | 7.62 | 8.60 | 7.55 | 4.49 | 5.72 |
Source: Own elaboration (BANXICO, 2022). https://www.banxico.org.mx/SieInternet/consultarDirectorioInternetAction.do?sector=18&accion=consultarCuadro&idCuadro=CF101&locale=es

Source: Own elaboration (BANXICO, 2022). https://www.banxico.org.mx/SieInternet/consultarDirectorioInternetAction.do?sector=18&accion=consultarCuadro&idCuadro=CF101&locale=es
Graph 7 Equilibrium interbank interest rate, 2010- 2021 (at the end of each year)
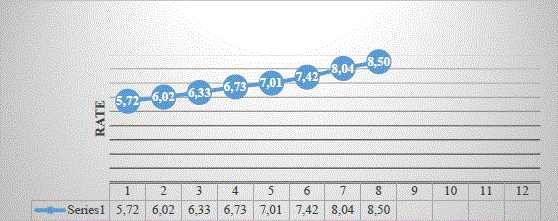
Source: Own elaboration (BANXICO, 2022). https://www.banxico.org.mx/SieInternet/consultarDirectorioInternetAction.do?sector=18&accion=consultarCuadro&idCuadro=CF101&locale=es
Graph 8 Equilibrium interbank interest rate, January-August 2022 (28-day quote)
5. CETES RATE OF RETURN
Table 5 CETES rate of return (28-day)
| Periodo | 2010 | 2011 | 2012 | 2013 | 2014 | 2015 | 2016 | 2017 | 2018 | 2019 | 2020 | 2021 | 2022 |
| Enero | 4.49 | 4.14 | 4.27 | 4.15 | 3.14 | 2.67 | 3.08 | 5.83 | 7.25 | 7.95 | 7.04 | 4.22 | 5.50 |
| Febrero | 4.49 | 4.04 | 4.32 | 4.19 | 3.16 | 2.81 | 3.36 | 6.06 | 7.40 | 7.93 | 6.91 | 4.02 | 5.94 |
| Marzo | 4.45 | 4.27 | 4.24 | 3.98 | 3.17 | 3.04 | 3.80 | 6.32 | 7.47 | 8.02 | 6.59 | 4.08 | 6.52 |
| Abril | 4.44 | 4.28 | 4.29 | 3.82 | 3.23 | 2.97 | 3.74 | 6.50 | 7.46 | 7.78 | 5.84 | 4.06 | 6.68 |
| Mayo | 4.52 | 4.31 | 4.39 | 3.72 | 3.28 | 2.98 | 3.81 | 6.56 | 7.51 | 8.07 | 5.38 | 4.07 | 6.90 |
| Junio | 4.59 | 4.37 | 4.34 | 3.78 | 3.02 | 2.96 | 3.81 | 6.82 | 7.64 | 8.18 | 4.85 | 4.03 | 7.56 |
| Julio | 4.60 | 4.14 | 4.15 | 3.85 | 2.83 | 2.99 | 4.21 | 6.99 | 7.73 | 8.15 | 4.63 | 4.35 | 8.05 |
| Agosto | 4.52 | 4.05 | 4.13 | 3.84 | 2.77 | 3.04 | 4.24 | 6.94 | 7.73 | 7.87 | 4.50 | 4.49 | 8.35 |
| Sep. | 4.43 | 4.23 | 4.17 | 3.64 | 2.83 | 3.10 | 4.28 | 6.99 | 7.69 | 7.61 | 4.25 | 4.69 | |
| Oct. | 4.03 | 4.36 | 4.21 | 3.39 | 2.90 | 3.02 | 4.69 | 7.03 | 7.69 | 7.62 | 4.22 | 4.93 | |
| Nov. | 3.97 | 4.35 | 4.23 | 3.39 | 2.85 | 3.02 | 5.15 | 7.02 | 7.83 | 7.46 | 4.28 | 5.05 | |
| Dic. | 4.30 | 4.34 | 4.05 | 3.29 | 2.81 | 3.14 | 5.61 | 7.17 | 8.02 | 7.25 | 4.24 | 5.49 |
Source: Own elaboration (BANXICO, 2022). https://www.banxico.org.mx/SieInternet/consultarDirectorioInternetAction.do?sector=22&accion=consultarCuadro&idCuadro=CF107&locale=es

Source: Own elaboration (BANXICO, 2022). https://www.banxico.org.mx/SieInternet/consultarDirectorioInternetAction.do?sector=22&accion=consultarCuadro&idCuadro=CF107&locale=es
Graph 9 CETES rate of return 2010- 2021 (at the end of each year)
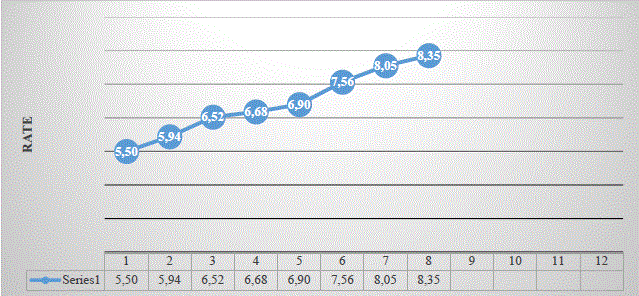
Source: Own elaboration (BANXICO, 2022). https://www.banxico.org.mx/SieInternet/consultarDirectorioInternetAction.do?sector=22&accion=consultarCuadro&idCuadro=CF107&locale=es
Graph 10 CETES rate of return, January-August del 2022 (at the end of each month)
6.INVESTMENT UNITS (UDIS)
The UDI is a unit of account of constant real value to denominate credit titles. It does not apply to checks, commercial contracts, or other acts of commerce.
Table 6 Investment units (value concerning pesos)
| Periodo | 2010 | 2011 | 2012 | 2013 | 2014 | 2015 | 2016 | 2017 | 2018 | 2019 | 2020 | 2021 | 2022 |
| Enero | 4.37 | 4.56 | 4.73 | 4.89 | 5.10 | 5.29 | 5.41 | 5.62 | 5.97 | 6.25 | 6.44 | 6.64 | 7.12 |
| Febrero | 4.41 | 4.57 | 4.75 | 4.92 | 5.13 | 5.29 | 5.43 | 5.69 | 6.00 | 6.25 | 6.46 | 6.70 | 7.18 |
| Marzo | 4.44 | 4.59 | 4.75 | 4.94 | 5.15 | 5.30 | 5.44 | 5.71 | 6.02 | 6.26 | 6.49 | 6.75 | 7.24 |
| Abril | 4.46 | 4.59 | 4.75 | 4.97 | 5.15 | 5.32 | 5.45 | 5.75 | 6.03 | 6.28 | 6.43 | 6.79 | 7.31 |
| Mayo | 4.43 | 4.58 | 4.71 | 4.96 | 5.13 | 5.29 | 5.42 | 5.75 | 6.01 | 6.27 | 6.42 | 6.81 | 7.33 |
| Junio | 4.41 | 4.55 | 4.74 | 4.95 | 5.13 | 5.28 | 5.42 | 5.75 | 6.01 | 6.26 | 6.44 | 6.83 | 7.36 |
| Julio | 4.42 | 4.57 | 4.77 | 4.95 | 5.14 | 5.28 | 5.42 | 5.76 | 6.04 | 6.27 | 6.49 | 6.87 | 7.43 |
| Agosto | 4.43 | 4.58 | 4.78 | 4.95 | 5.16 | 5.29 | 5.44 | 5.79 | 6.07 | 6.29 | 6.52 | 6.90 | 7.47 |
| Sep. | 4.44 | 4.59 | 4.80 | 4.97 | 5.18 | 5.31 | 5.45 | 5.82 | 6.11 | 6.29 | 6.55 | 6.92 | |
| Oct. | 4.47 | 4.61 | 4.83 | 4.99 | 5.20 | 5.33 | 5.49 | 5.84 | 6.13 | 6.31 | 6.57 | 6.97 | |
| Nov. | 4.50 | 4.64 | 4.85 | 5.02 | 5.23 | 5.36 | 5.53 | 5.89 | 6.17 | 6.35 | 6.60 | 7.04 | |
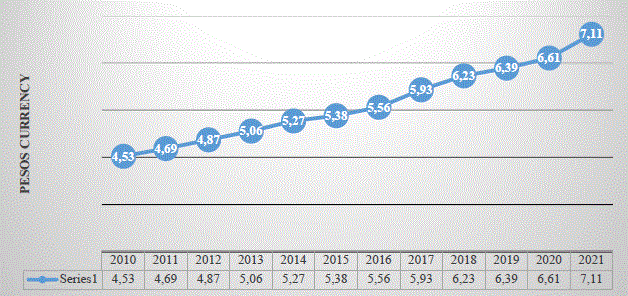
| Dic. | 4.53 | 4.69 | 4.87 | 5.06 | 5.27 | 5.38 | 5.56 | 5.93 | 6.23 | 6.39 | 6.61 | 7.11 |
Source: Own elaboration (BANXICO, 2022). https://www.banxico.org.mx/SieInternet/consultarDirectorioInternetAction.do?accion=consultarCuadro&idCuadro=CP150&locale=es
Source: Own elaboration (BANXICO, 2022). https://www.banxico.org.mx/SieInternet/consultarDirectorioInternetAction.do?accion=consultarCuadro&idCuadro=CP150&locale=es
Graph 11 Investment units 2010-2021 (At the end of the year)
Source: Own elaboration (BANXICO, 2022). https://www.banxico.org.mx/SieInternet/consultarDirectorioInternetAction.do?accion=consultarCuadro&idCuadro=CP150&locale=es
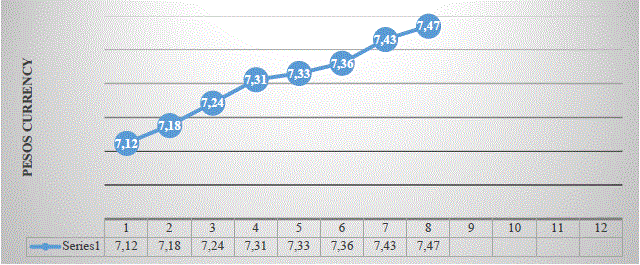
Graph 12 Investment units, January-August 2022
METHODS AND MODELS USED IN SENSITIVITY ANALYSIS
The Iman Researchers, (1990); and Helton (1993), in addition to promoting the use of global sensitivity as well, have tested robust methods based on Monte Carlo regression, correlation analysis and the use of scatter diagrams. Standardized output coefficients (SRC), measures of correlation (Pearson), and partial correlation coefficients (PCC) have also been used successfully in sensitivity models.


 nueva página del texto (beta)


