1. Introduction
Material surfaces are highly exposed to environmental conditions 1, contamination, dirt 2), (3, dust 4, sand 5, acidic water, oily substances 6, etc. In general, many of these conditions are undesirable since they negatively influence the useful life of the material and its performance 7), (8. Some surfaces are more often faced with certain substances and are therefore more prone to damage 7. That is why, for some years now, scientists have tried to create surfaces that meet certain needs 8, starting from knowing the characteristics and abilities of some plants and animals.
One of the most studied conditions in recent times is high-hydrophobic condition. Ultra-hydrophobic (UH) surfaces show values of SCA between 120-1500 (9, while in superhydrophobic (SH) surfaces are above of 150° 2) (6) (12), (13), (14), (15), (16), (17), (18), (19 between the solid phase and the liquid phase. This characteristic allows a wide number of applications, including self-cleaning 8), (10), (11), (12), (13), (14), (15), (16, drag reduction 8) (12) (17, anti-corrosion 8) (10) (18), (19), (20), (21, transparency 8) (22), (23, anti-icing 16), (18) (19), (20, oil-water separation 17), (18 and so on. This type of surface influences the reduction of maintenance costs 24 and increases the useful life of the materials 25.
There are two approaches to achieve high-hydrophobic conditions: (i) increase surface roughness 26), (27), (28), (29, (ii) decrease surface tension 20) (30), (31), (32), (33. The first approach is related to the idea of reducing, as much as possible, the contact area between liquid and solid, and in turn, being able to create spaces in which air bubbles can be located 20) (31) (34), (35), (36 that serve as a barrier (protects the drop from morphological irregularities that can undo them). The second approach is closer to the chemical composition, which determines the adhesion forces present in the contact area 37), (38), (39), (40.
There are compounds that make it possible to achieve superhydrophobic characteristics through the application of the aforementioned approaches, specifically the use of silanes. Vouvoudi et al. 1 manufactured a superhydrophobic coating for the protection of the stone-built cultural heritage. They reported SCA of 1700 approximately. To do this, they mixed tetraethyl orthosilicate (TEOS) and 1H, 1H, 2H, 2H-perfluorooctyl tri-ethoxy silane (FAS). Finally, the versatility of the solution allowed excellent results on at least 3 more substrates 1. Zhu et al. 26 created a transparent SH coating with good mechanical properties. The silane used was polydimethylsiloxane (PDMS), which is not contaminating like those containing fluorine. The modification achieved by this compound allowed reaching values of SCA higher than 1600 and transparency levels higher than 76% 26.
In this article, we report the development of UH and transparent coatings through SCA optimization based on a general full factorial design. The coatings show SCA values greater than 1400 and transparency values greater than 65%. The corresponding characterizations were carried out.
2. Methodology
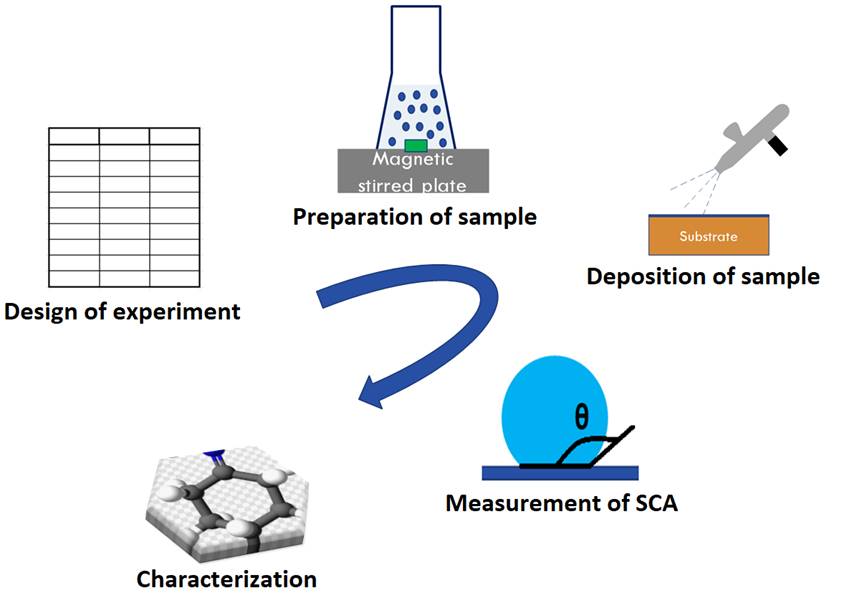
The Figure 1 illustrates the steps to follow in the present investigation.
2.1 Materials
The following materials were used for the preparation of the coatings: tetraethyl orthosilicate (TEOS), (98% from Sigma-Aldrich) as a precursor for SiO2 nanoparticles; Ammonium hydroxide (NH4OH), (NH3 content 28-30% from Sigma Aldrich®) that influences the size of the nanoparticles; 1H, 1H, 2H, 2H-perfluorodecyltriethoxysilane (AC-FAS) (97% from Matrix Scientific®) is applied as a surface modifier; isopropyl alcohol (IPA) and deionized water (DIW).
2.2 Equipments
Stirring hot plate (model PC-420D, CORNING®. Ultrasonic cleaning bath (model TS-2.5L), truSonik ®.
2.3 Design of experiment (DOE)
The DOE chosen was a general full factorial design. The Figure 2 illustrates a general analysis for our investigation.
The inputs for this design were the drying time of coatings and deposition time between layers. The controllable factors were the NH4OH concentration, the number of layers and the applied droplet volume to measure the static contact angle. As an uncontrollable factor, it was only defined at room temperature. The output variable was established as the SCA. All prepared samples were made up to a volume of 50 ml. Table 1 shows the agent volumes in each sample.
Table 1 Agent volumes
| Samples | IPA (ml) | DIW (ml) | TEOS (ml) | AC FAS (ml) | NH4OH (ml) |
| M1 | 36.8 | 11.71 | 1 | 0.15 | 0.5 |
| M2 | 37.04 | 11.71 | 1 | 0.15 | 0.25 |
| M3 | 37.24 | 11.71 | 1 | 0.15 | 0.05 |
| M4 | 37.265 | 11.71 | 1 | 0.15 | 0.025 |
The only difference between samples is the NH4OH content. This difference made it possible to assess the influence of NH4OH on SCA.
2.4 Preparation of samples
The preparation procedure proposed by Ge et al. 41. Prior to the preparation, a deep wash of all the necessary elements (glass Erlenmeyer flasks, pipette tips, magnetic stirrers) was carried out to develop the preparation of the samples. The washing was carried out with DIW and alconox® detergent, and subsequently they were rinsed with DIW and IPA. The preparation of the solutions was started by stirring a mixture of IPA and DIW at 500 rpm, in a 100 ml glass Erlenmeyer flask, for 10 min. Then NH4OH and TEOS were added in the order mentioned and kept at the same angular stirring speed for 24 h. After the planned time, the AC-FAS was added and 48 h were waited to turn off the stirring hot plate machine, in this way the preparation process was concluded. The entire process was carried out at room temperature.
2.5 Spray Deposition
Prior depositing the solution on the substrate (26 x 76 x ± 1-1.2 mm glass slides, from Lauka®), it was placed in the ultrasonic cleaning bath machine in order to achieve a greater degree of homogeneity of the solution. The spray gun was also washed as an essential element of the selected method. The spray method was carried out at 15 cm from the substrate placed horizontally, the firing pressure was 0.2 MPa at room temperature. The deposition time between coats was set at 10 min, while the final drying time (time in which the SCAs were measured was 24 h). The drying was carried out naturally (air).
2.6 Characterization
The chemical composition and morphology of the surface, and NPs size analysis were carried out with the use of the field emission scanning electron microscope (FESEM) (JEOL® brand, model JSM-7000F) and energy dispersive spectrometer (EDS). The volume ratio between IPA and samples was 10: 1, and it was deposited on a carbon adhesive tape. Fourier transform infrared (FT-IR) spectrophotometer (BUCK Scientific®, model 530), it was used to identify the functional groups in a wavenumber interval of 600-4000 cm-1, and a resolution of 0.8 cm-1; the samples had to be prepared with potassium bromide (KBr). Ultraviolet visible light (UV-vis) spectrophotometer (series AF1311015) was used to determine the light transmittance in a range of 380-760 nm with intervals of 1 nm. SCA measurement was achieved with a Profile Projector (Mitutoyo Corporation®, model PH-A14).
3. Results and Discussion
3.1 Statistical analysis
Images for SCA measurement were obtained using a profile projector and analyzed with the ImageJ software. Table 2 shows the SCA values.
Table 2 Static contact angles
| Samples | SCA-5 µl ( 0) | SCA-10 µl ( 0) |
| M1 (2 layers) | 147±2 | 146.2±3 |
| M1 (4 layers) | 152.55±1 | 150.6±2 |
| M2 (2 layers) | 148.4±2 | 148.2± |
| M2 (4 layers) | 150±2 | 150.3±2 |
| M3 (2 layers | 146.8±3 | 143.3±2 |
| M3 (4 layers) | 151.4±2 | 151±1 |
| 4 (2 layers) | 145.9±3 | 144.1±3 |
| M4 (4 layers) | 151.8±1 | 151.7±1 |
Table 2 presents all the values in a range of 141-1530 when the highest value was 152.55 ± 10 and it was reached in M1. Table 2 shows that, as the number of layers increases, the SCA increases. The number of layers is a factor that can be directly related to the thickness of the coating, because, as the number of layers increases, the thickness increases. Ge et al. 41 investigated the influence of thickness on SCA for a coating obtained from the mixture of two silanes, TEOS and (heptadecafluoro-1,1,2,2-tetrahydrodecyl)triethoxysilane (HDFTES), with a stringed SiO2 NPs. The result shows that when increasing the thickness of 2-8 µm, the SCA increased from 160.5-165.50 approximately 41. This result coincides with the result obtained in this investigation. Purcar et al. 42 reported the influence of thickness on the SCA of SiO2-based coatings obtained from TEOS and modified with alkoxysilane mixtures using the sol-gel method. The alkoxysilanes used were methyl triethoxysilane (MTES), octyltriethoxysilane (OTES), vinyltrimethoxysilane (VTMES), and hexadecyltrimethoxysilane (HDTMES). The thicknesses for TEOS/MTES/OTES, TEOS/MTES/VTMES and TEOS/MTES/HDTMES were 3522.8, 1288.0 and 1584.9 nm respectively; their respective SCAs for the thicknesses obtained were 104, 88 and 1060 (42. The presence of a second factor included in the analysis caused a change in the results. This time the study included, in addition to thickness, the type of alkoxysilane, which led to the loss of the relationship obtained in the present study and increases in SCA were not achieved with increasing thickness.
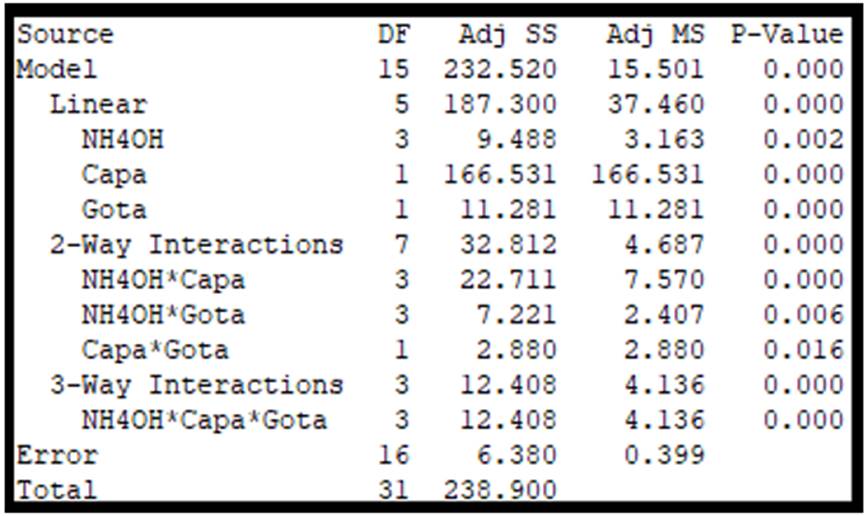
Using the Minitab® 17 software, it performed the general full factorial design to determine if the factors taken into account significantly influence the response variable. The experiment was randomized and replicated to ensure a more reliable test. Figure 3 presents the results of the analysis.
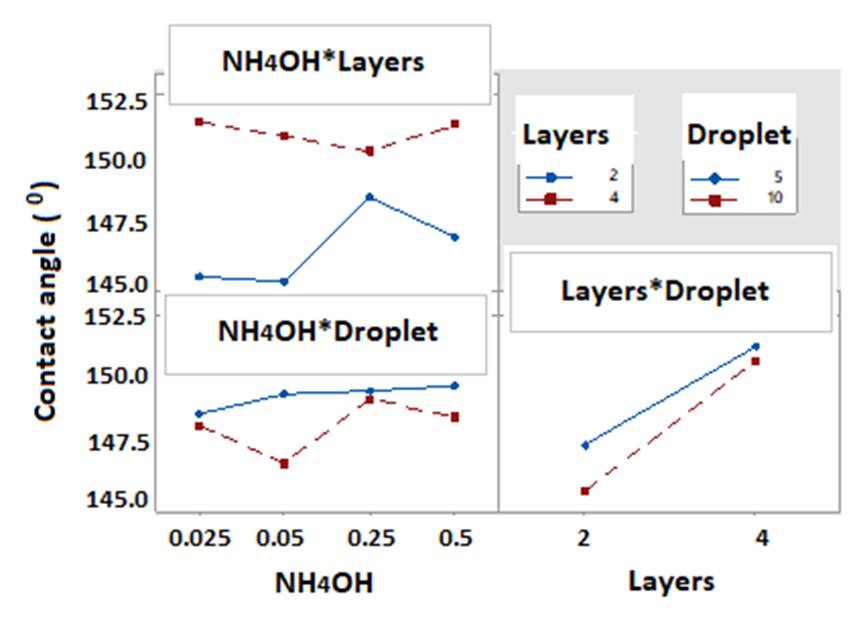
Taking into account a confidence level of 95%, the significant factors will be those that do not exceed the level of significance (0.05). As can be seen, the three factors proposed in the experiment showed p-values lower than the reference value mentioned above. Similarly, double and triple interactions have p-values lower than the reference value. All this information allows us to declare that all the factors and their interactions will be significant for the response variable. It also generated the main effects plot for SCA to more easily observe the influence of each factor on the response variable. Figure 4 presents the directions we can choose from each factor to increase SCA.
Figure 4 presents the behavior of each factor in this investigation. The NH4OH factor showed better SCA values at the levels with the highest concentration of NH3; the number of layers confirmed that as it increased, the values of the response variable increased too; while an increase in drop volume tends to decrease SCA. These SCA results make it possible to ensure that the three factors influence the achievement of ultrahydrophobicity (120 <SCA≤1500); in addition, in the particular case of number of layers, 4 layers allowed achieving superhydrophobicity (SCA> 1500). Figure 5 allows a double interaction analysis of the factors.
This figure shows the interactions between factors, and it is evidenced that the least interaction is established between NH4OH and number of layers. On the other hand, between number of layers and drop volume a certain closeness and similar direction is perceived, which allows to ensure that it is the interaction that has the most effect on SCA; the highest SCA values were reached for this interaction.
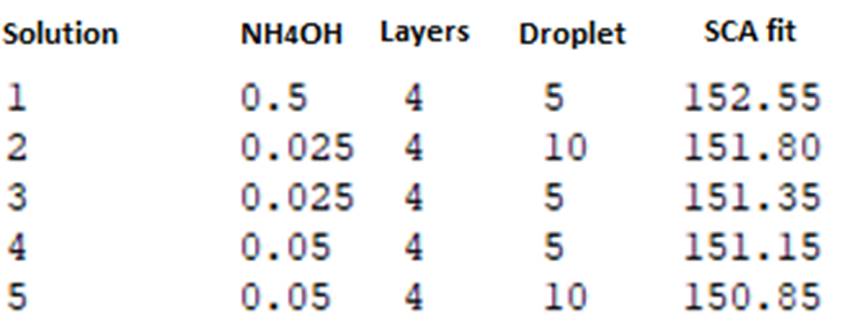
The response variable was maximized to determine the 5 best combinations of factors. Figure 6 shows the response optimizer.
Fig. 6 allows determining the combinations of factors with the highest SCA values. The response optimizer presented the 5 highest SCA values in the study. All combinations met the maximum number of layers deposited (4 layers), this confirms the idea that to achieve superhydrophobic surfaces it was necessary to apply 4 layers of coatings. The highest value obtained was 152,550.
3.2 Functional groups analysis
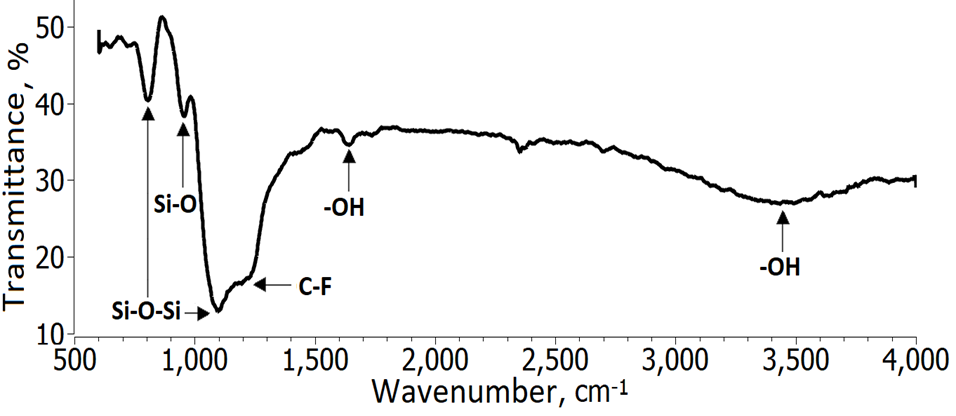
The analysis of the functional groups was carried out with a FT-IR. In Figure 7 the spectrum generated by the SiO2 NPs is observed.
In the FT-IR spectrum of glass substrate, a broad band were identified from 2750-3800 cm-1 with center at approximately 3400 cm-1, corresponding to the hydroxyl stretching (-OH stretching vibrations) 1) (37), (38), (39, then another -OH group was observed around 1630 cm-1. The C-F stretching vibrations peak at 1204 cm-1 was easily recognized in the spectrum 41) (43; these groups are characterized by having low energy, they are attributed a decrease in the surface energy of the coating. The peak at 1100 cm-1 was attributed to the most characteristic peak of the SiO2 nanoparticles 1) (37), (38, which is assigned to the asymmetric stretching, symmetric stretching and bending vibration. Finally, two more peaks were located below 1000 cm-1: (i) at 950 cm-1 (Si-O bond) 42 and (ii) at 793 cm-1 belong to vibrations Si-O-Si bonds 1) (26) (41) (44 attributed to the bending vibrations.
3.2 Chemical composition
The chemical composition was evaluated with the use of FESEM-EDS. The solution was analyzed before adding the AC-FAS and another with all the reagents that make up the coating. In addition, images of the distribution of each chemical element in each sample were obtained, as shown in Figure 8.
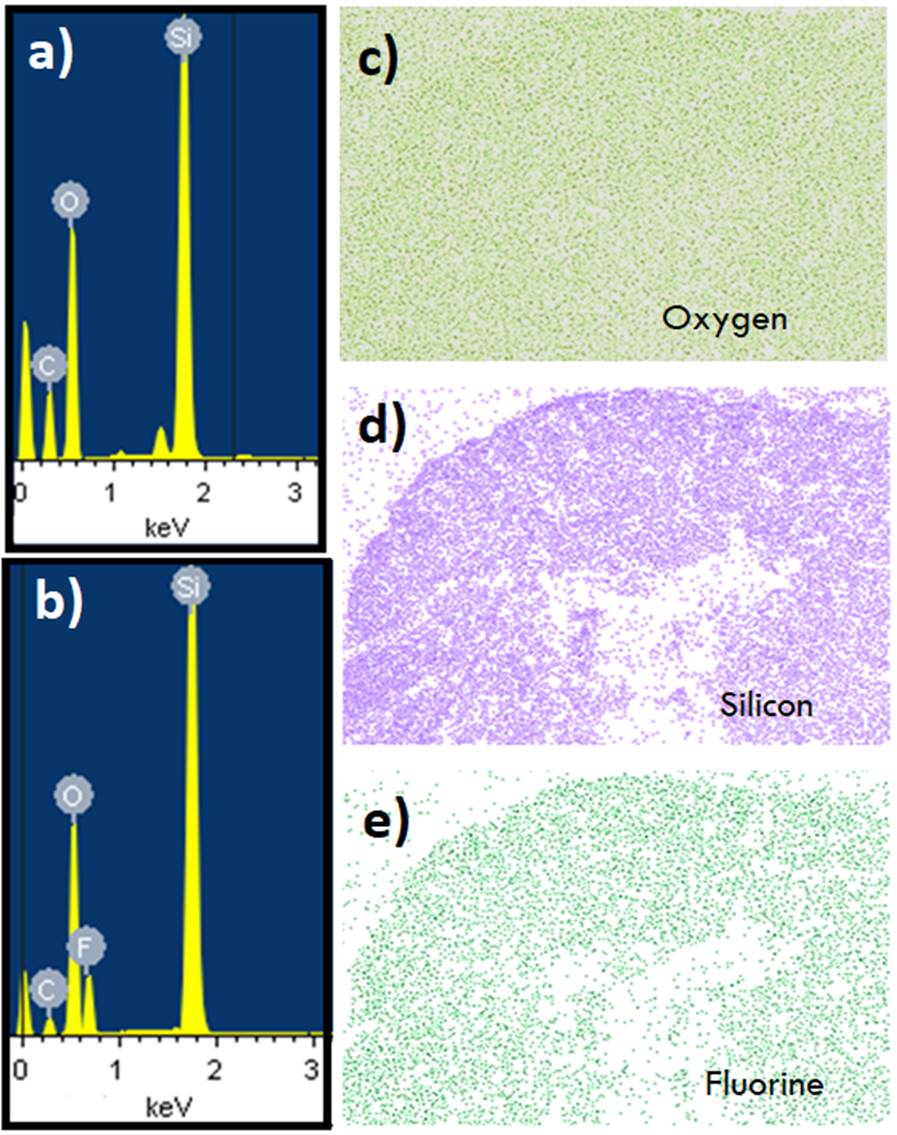
Figure 8 FESEM (EDS mapping) images (sample M3): (a) Solución sin AC-FAS, (b) solución con AC-FAS, (c) Oxygen map, (d) Silicon map, and (e) Fluorine map.
In Figure 10 (a, b), the presence of Si, O and C is observed, while F only appears in Figure 10b due to the addition of AC-FAS. All chemicals were evenly distributed over the entire surface, suggesting that the preparation method used was appropriate to achieve a uniform coating.
3.3 Surface morphological study
The morphological analysis was carried out in FESEM. Figure 9 showed the surface morphology of the sample M3.
The images obtained in SEM showed a large agglomeration of particles. This agglomeration can be a consequence of the addition of AC-FAS. This agglomeration can also decrease the degree of hydrophobicity, and can be the cause of a decrease in the percentage of light transmittance. Finally, particle agglomeration made particle size determination impossible.
3.5 Transparency analysis
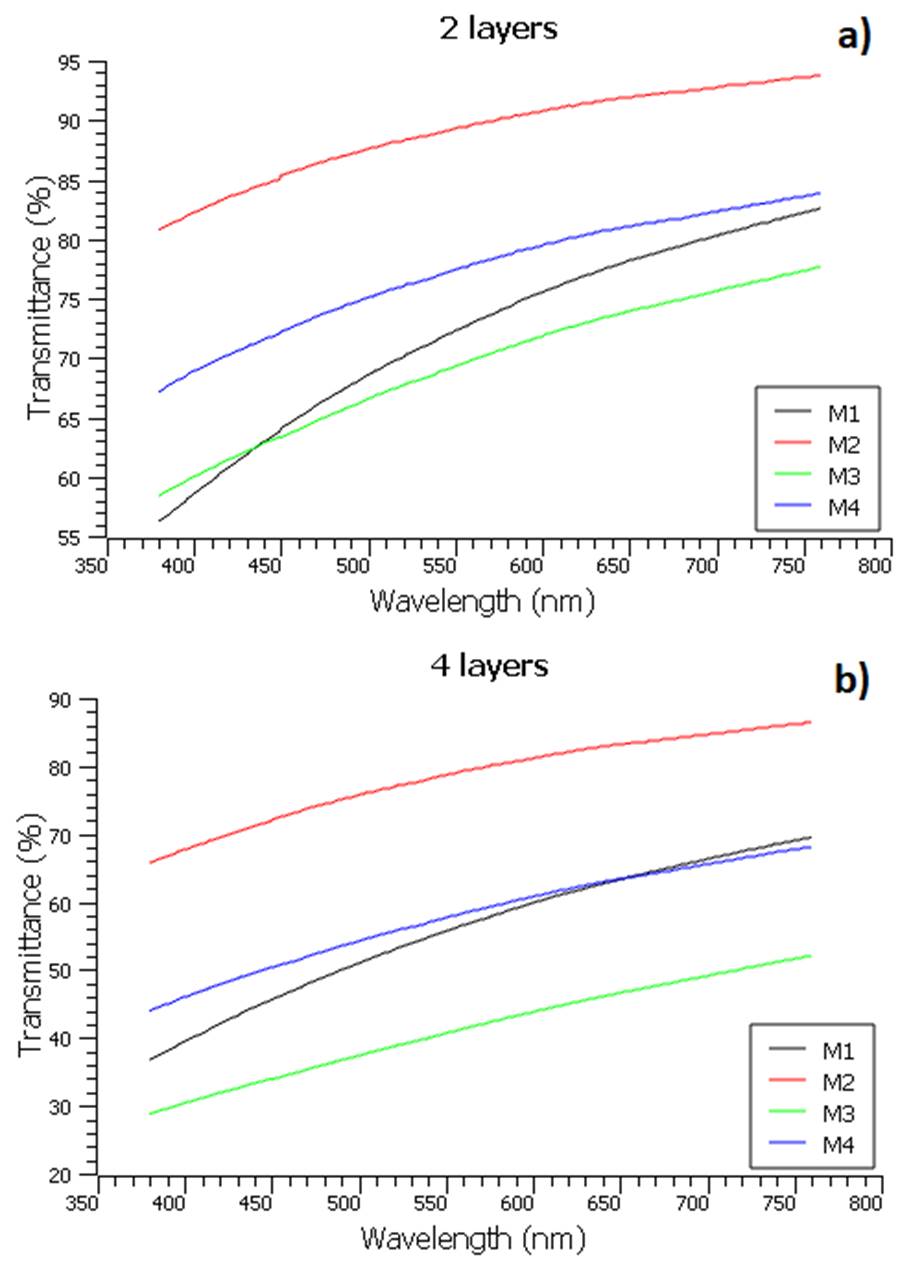
The transparency of all samples (2 and 4 layers) was determined by using the UV-vis spectrophotometer; all analysis was performed in the wavelength interval 380-760 nm. Figure 10 shows the transmittance spectra of the coatings.
As shown in Figure 10a, the M2 lost 11% of the transmittance compared to an uncoated glass (100%), for 89% of transmittance, approximately. The other samples presented average values in a range of 68-80%. When the number of layers was increased to 4 (Figure 10b), there was a loss of transmittance of 23% (sample 2), while the others were less than 60%. These results suggested that by increasing the number of layers there was an increase in surface roughness, which led to an increased light scattering, thus decreasing the light transmittance. In this case, the number of layers is analogous to the number of cycles, which increases the thickness of the coating as it increases. H. Teisala et al. 45 transparency was investigated using UV-vis spectrophotometer for different Si/Ti ratios. The results were obtained by applying 1 and 5 coating cycles on the substrate. For 1 cycle, all transmittance values were greater than 98% for wavelengths greater than 500 nm. For 5 cycles, 97% were obtained in Si-100% and 79% with Si-1%, which indicated a decrease in transmittance as the concentration of Si in the coatings decreased 45. It can be noted that this result agrees with the result obtained in our study, the increase in the number of cycles has a negative effect on the level of transparency 45. Ge et al. 41 investigated the influence of thickness on the transparency results of coatings made with a TEOS/HDFTES solution with stringed SiO2 nanoparticles. The range in which the measurements were made was 3-8 µm and it was observed that as the thickness increased there was a decrease in transmittance; the transmittance obtained was approximately 91.5% at 550 nm for a thickness of 5 µm 41. This result also confirms our result.
4. Conclusions
Ultra-hydrophobic coatings based on SiO2 nanoparticles were developed using the sol-gel method. The SCA obtained exceeded 1400, reaching values above 1500 (super-hydrophobicity). The influence of three factors (NH4OH, number of layers and droplet volume) on the ACS was analyzed using a general full factorial design with a 95% confidence level. All the factors were statistically significant for the output variable. By increasing NH4OH there was an increase in SCA; when the number of layers increased, the SCA also increased; while with increasing droplet volume, SCA decreased. Other studies show similar results for the number of layers because it is related to the increase in surface roughness; This factor is also the main responsible for achieving SCA values higher than 1500.
The FESEM images showed an excessive agglomeration of particles, an aspect that must have had a negative impact on the results of contact angles and that prevented the determination of the particle size; agglomeration was attributed to AC-FAS.
The analysis of functional groups permitted to identify SiO2 nanoparticles, which shows that the sol-gel method is appropriate for this objective; It was possible to verify the presence of C-F groups, to which the decrease in the surface energy of the coating and the high degree of hydrophobicity due to its low energy are attributed.
Transparency levels of 68-89% were achieved. The number of layers negatively influenced the level of transparency, reducing the transmittance of sample M2 from 89 to 77 for 2 and 4 layers respectively. This result was consistent with studies conducted by other researchers.
In this study, we managed to include a factor not widely studied: droplet volume. In addition, the coatings developed can be implemented in applications such as self-cleaning, anti-reflection, anti-corrosion, among others.


 nueva página del texto (beta)


