


 nueva página del texto (beta)
 Inglés (pdf)
 Artículo en XML
 Referencias del artículo
 Enviar artículo por email
 Citado por SciELO
  Similares en
SciELO
Similares en
SciELO 
 Permalink
Introduction and justification
There is a seminal question of financing renewable energy projects in the case of developed versus developing economies, mainly because in the latter, financial institutions and instruments are argued to be shallower and projects face relatively higher regulatory and market risks than on the former developed countries. The question has consequences in the welfare front and the quest to solve the asymmetry of economic bases, financial instruments, and financing strategies. Critical points need to be spelled out to create a framework not only on the institutions of energy markets and their risks, but also focused on financial strategies and instruments to both promote investment in renewable generation (wind, solar, clean co-generation, mini-hydro, tidal, etc.), while securing financial soundness in financing strategies and instruments. The present investigation specifically addresses types of financing to optimize financing returns from financial strategies, while promoting such investments, applied specifically to two renewable technologies: solar-pv, and wind.
The paper is organized as follows: After framing the critical literature on both renewables markets and their dynamics in the literature, plus main addressing of financial conditions for renewable project financing in the next section, section 3 frames the problem handoff financing small renewable projects, mainly in developing markets. Section 4 spells out an agency-based theoretical model between project development and alternative financing and presents theoretical propositions. Section 5 explores some empirics of the on-going research, while Section 6 concludes.
Literature review
The Electricity and Renewables Markets and their Dynamics
After many years of a vertically integrated incumbent utility, many countries embarked in vertically separating competitive areas of electricity generation, self-supply, commercialization and trading, and the development of an independent system operator (ISO) to promote development of renewable energies, mainly since the beginning of the 21st century (Bieleki 2004; Hogan, IRENA 2018; Rosellón, and Vogelsang 2010; IEA 2018; Rosellón, Myslikova, and Zenon 2011; Wolak, 2005). Vertical separation began in developed economies in the eighties (i.e. the UK), but soon after, it was also applied to a bundle of developing countries (i.e. Chile, Argentina, and Mexico in Latin America).
The beginning of deregulated markets gave a key role to the regulator to apply asymmetric rules for the monopolistic part of the (wholesale) markets, while it promoted a wholesale market with many participants in an increasing atomized environment and increasing number of renewable producers, consumers, and traders. Such focus has been addressed by many (EIA 2011; Griffin and Puller 2005; Ibarra-Yunez 2017; Maurer and Barroso 2011 on auctions as an effective vehicle to promote new investments; OFGEM 2010 on the UK deregulation; Pollitt 2012, on challenges in asymmetric deregulation; Stoft 2006 on vertical disintegration models).
The dynamics and strategic space for renewable sources of energy and the role of non-conventional generation has increasingly been studied. However, given technology and market development, hurdles for the renewable, intermittent, hence non-dispatchable generation has also been stressed by recent studies such as Bunn and Muñoz (2015); Bushnell, and Novan (2018); Egerer, and Schill (2014) on the conditioning of generation by transmission and interconnection market failure; Egerer, Rosellón, and Schill (2015), on regulatory incentives for renewables, but also IEA (2018), and, more recently, IRENA (2020),
Moreover, on regulatory and market failure models, authors that have addressed welfare deviation phenomena include Bushnell, Mansur, and Saravia (2008), on the dynamics of new market arrangements; Höfner and Cranz (2011) on legal unbundling imperfections; Jamasb and Pollitt (2005), on applications to Europe; Joskow (2005) for an application to the California market failure of 2003; Joskow (2008) on the future of liberalization; Kwoka (2008) on the US restructuring; Matsuyama (1990) on imperfect and conditional investment; and Pollitt (2012) on the soundness of an independent system operator (ISO/ RTO).
Recent scientific contributions have increasingly used agency-based approaches to emphasize asymmetric objectives and incentives of renewable projects between investment owners and promoters, as opposed to funding incentives and institutions. Examples are Van der Berg, & Tempels (2022) for a case study in the Netherlands; and Martinez-Climent (2021) for a model in Spain.
The promotion and dynamics of clean energy and non-conventional renewable energy projects by technology, and the means to promote their uptake has been addressed by fewer authors. However, the subject has been framed and studied by seminal works from Bunn and Muñoz (2015) on intermittency as a source of financial risk on renewable projects; Mexico’s CENACE (2015) on renewables planning and launching; Europe’s THINK project (2013) applied to the uptake of renewables. Poltzin et al. (2015) studied a data panel of investments on renewables and their policy influences by technological maturity; while Ibarra-Yunez, et al. (2017), concentrated on the legal framework for solar-PV projects in California and Mexico. The present research and contribution aim to close the agent-based approach to projects in alternative financing. For that purpose, a further brief review of the finance literature follows.
The financial strategy, institutional development, and instruments of financing non-conventional project development
Fewer research has addressed the paucity of analyses for asymmetric settings between developed and developing economies (Liming,2009; Kutan, Paramati, Ummalla, and Zakari, 2017) mainly because the strength and maturity of financial institutions (banks and non-banks), and their instruments of financing small scale renewable projects, characterized by their intermittent character, are starkly different in that they need to internalize relatively higher financial, economic, and policy risks to these projects. In them policy plays a key role as a complement origin of both finance (subsidies policies, feed-in tariffs in Europe, tax policy applied to promote renewables uptake in investment projects, venture capital as financial options), and deregulation and asymmetric regulation by project layers or echelons.
Very recently, Mazzucato and Semieniuk (2018) studied several types of financial actors (including private banks, public banks, private utilities, and public utilities) and created a risk measure based on technology and market risk exposure to the financial actors, given their investment portfolio across technologies and countries. Some other authors have analyzed the relationship between policy and renewal energy deployment in several different ways, some of which develop game-theoretical mathematical models. Main contributions include Delmas and Montes-Sancho, 2011; Harmelink, Voogt and Cremer, 2006; Jacobsson, Bergek, Finon, Lauber, Mitchell, Toke and Verbruggen, 2009; Menz and Vachon, 2006.
However, only a few quantitative analyses address the influence of public policies on investments in clean energy by private institutional investors (Bolkesjø, Eltvig and Nygaard, 2014; Chassot, Hampl and Wüstenhagen, 2014; Lüthi and Prässler, 2011; Lüthi and Wüstenhagen, 2012). Other alternative mechanisms such as government feed-in tariffs have been recently studied about their effectiveness and efficiency, mainly at the load part of the market, i.e., the demand part (Carley, 2009; Lesser and Su, 2008; Mathews, Kidney, Mallon and Hughes, 2010).
In contrast, others concentrate on subsidies as a support instrument that provide fiscal relief for renewal energy projects, mainly in the early stages of the technology development (Olmos, Ruester and Liong, 2012; Bergek, Mignon and Sundberg, 2013). Finally, new alternative mechanisms of private investment or alternatives mixed with public support, such as crowdfunding, social funds, green banks, and green bonds, have been used to help policy makers and renewal energy drivers, investors and project owners. Main referent papers are Yildiz (2014) who studied financial citizen participation in Germany; Lam et al. (2016) analyzed precisely the crowdfunding alternative for clean energy innovations and projects; Mathews and Kidney (2012) reviewed private sector involvement through the green bonds market, while Whitney (2014) provides a theoretical model for green banks’ participation on clean energy deployment.
Institutional framework and mapping
An important characteristic of renewable energy deployment is that the entire process of a project implementation is affected by barriers, relating both to the inherent characteristics of innovation and technological change, and to environmental externalities (Jaffe, Newell and Stavins, 2005). One of the most important barriers for clean energy implementation is the financing environment, as is emphasized here. Polzin (2017) describes a framework of such factors affecting funding behavior.
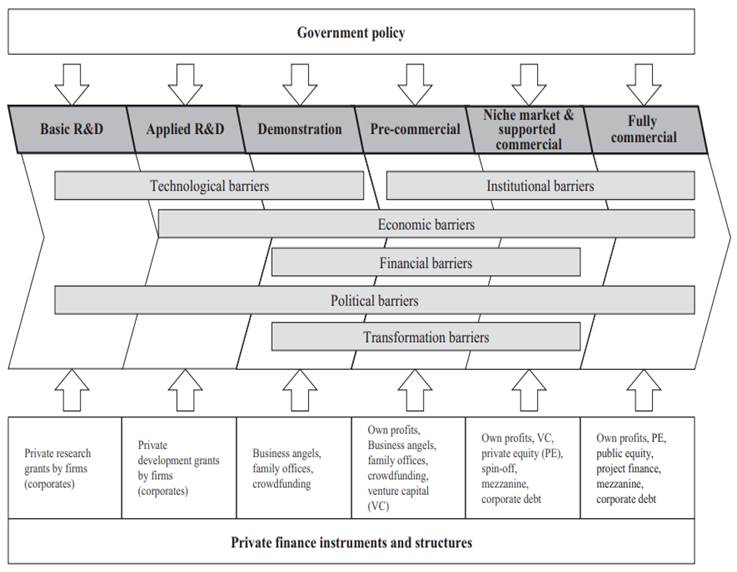
Source: Polzin, F. (2017). Mobilizing private finance for low-carbon innovation. A systematic review of barriers and solutions. Renewable and Sustainable Energy Reviews: 77, 525-535. At https://doi.org/10.1016/j.rser.2017.04.007
Figure 1 Barriers and private investment participation on renewable energy deployment
As is shown above, Polzin describes different steps in the process of clean energy innovation and implementation, at the government policy element, contrasting project stages. Each stage implies specific barriers and risks (including the government policy of the country). In the presence of such environment behavior, different private investment mechanisms play important roles. During the first two steps (R & D), technologies are developed by public research institutes or universities as well as private firms. In the next two steps, the most difficult ones even called the “valley of death” (Polzin, 2017), capital expenses are high as well as the risks of failure in the so-called pre-commercial stage of development. Thus, private financing agents (rather principals in game theory terms), such as business angels, family offices, crowd-funders and venture capitalists are the financial providers who accept the risk involved, as opposed to other financial institutions such as banks who restrain themselves from such project financing, while green bonds are recent and need underwriting in official institutional markets, that are often weak or non-existing.
In the last two steps where the technology starts to have commercial acceptance, funds can be collected from public resources, private equity or even from banks and formal financial institutions. Financing plays a key role for renewable energy innovation, implementation and promotion. The first steps of a clean energy project imply large amounts of capital investments with high risks involved.
Also, one could address the framework of financial instruments and set difficulties and challenges for the diverse sources of financing, following a World Bank (2013) framework, as follows:
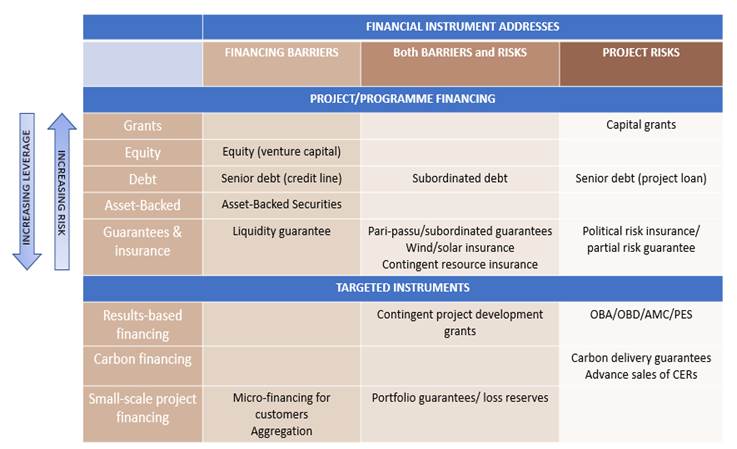
Source: World Bank (2013), “Financing Renewable Energy - Options for Developing Financing Instruments Using Public Funds. [Online] Available at: https://www.climateinvestmentfunds.org/cif/sites/climateinvestmentfunds.org/files/SREP_financing_instruments_sk_clean2_FINAL_FOR_PRINTING.pdf
gree ofEndogFigure 2 Financial Instruments and Deenous Risk
As can be seen, instruments to finance renewable energy projects by main technologies, depend on the degree of development of a country in question (developed versus developing), as well as the degree of development of the renewable technology in the projects, where the start-up cost is rather high, and the average levelized cost of energy (LCOE) of the alternative projects, imply financing barriers per se or challenges in both the financial soundness and the renewable technology and country development stage.
For example, insufficient development of financial instruments in the left column, such as venture capital, senior debt credit lines, or asset-backed securities, and green bank project financing, give rise to shallow financial backing of renewable projects. On the side of project risks, grants could be available in developed countries but much less so in developing economies. Also, project risk guarantees, project uptake insurance might not exist in some cases. All in all, the need to move behind these mentioned challenges calls for designing project finance that minimizes financial risks. Examples are stage financing, small scale financing, aggregated financing of a set of projects in a pool of renewable projects traded in the wholesale market, in what is called commercial virtual power plants CVPP, contingent project development grants where financing is provided in stages by the renewable energy projects, like a seminal contribution by Wang and Zhou (2004), or the emerging opportunities of crowdfunding as in Lam and Law (2016). Such stage financing and crowdfunding are emphasized in the present research.
Theoretical model and equilibrium
Theoretical Model
Framing a renewable energy project owner (REP) implies to invest in a solar (or wind) farm that is capital intensive. Assume also a project financier, for example a crowdfunder providing green investment (CF); both players are risk averse. Then, assume an electrical utility for both backup and procuring green energy products for the REP that is assumed to be risk neutral and passive in the present framework (alternative scenarios of incumbent playing a blockading role could also be modeled elsewhere in the research effort, as a third player). Let a game theoretical approach be followed as the preferred model, because of asymmetric objectives between the players, time asymmetries, and the risk inclusion.
The game between the REP and the CF should have a time asymmetry character since
one cannot assume immediate funding to integrate risk bearing in a
finite-conditional funding in stages. The game frame can be seen as follows: at
time
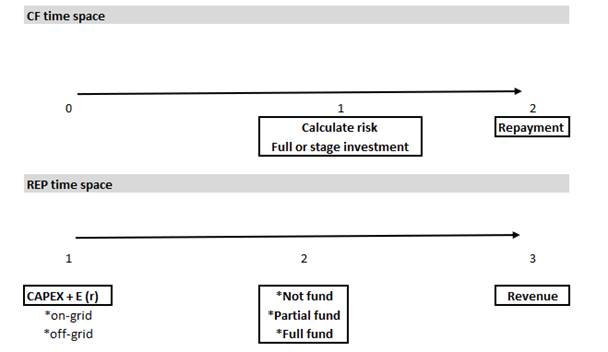
Time space of the REP is determined by
Following Zheng Ying-Xu, Chakraborty and Sycara
(2015), the utility provides energy to consumers with demand
Now the active REP supply
Let’s assume that the uncertain green output
The REP´s decision program is to maximize funding/output in the market:
On its part, the CF payoff to maximize follows from the above as:
Where
REP risk aversion utility
Equilibrium
Given all the setting described above, consider the options: a) no crowdfunding; b) full crowdfunding with a risk assumption; c) crowdfunding stage funding with risk assumption in stages.
No crowdfunding
In the base case, the utility determines wholesale prices
For the utility, it chooses the wholesale price that minimizes the expected procurement cost.
So, the optimal
Crowdfunding in one shot form
Additional to the REP self-funding
For the CF, each investor payoff under investment decision (
Stage/conditional funding
Then the CF sends all part of the risk factor of the maximization towards the REP, that needs to forecast each stage 1,2,3 net revenues from investing
With the above alternatives, one could further the following hypotheses:
Hypothesis 1.- In the case of no crowdfunding, the REP will face the wholesale price set by the utility w t and will be increasing in energy generated (scale of the REP), and the funding the utility is willing to pay, given its own cost minimization E [c 0 (w)]. The cutoff equilibrium will be w*
Hypothesis 2.- In the case of funding on one shot, the utility will face a wholesale price requirement w** < w* to cover its relationship with the REP, meaning that the CF becomes the active participant principal of the REP agent. For the REP, it will invest in the renewable project N* 0 (w) depending now on the amount of funds from the CF, and investment costs.
Hypothesis 3.- In the case of full financing, the CF principal will offer the funds in period 2 that integrate the net expected revenue from the REP agent, with the project risk subtracted from net REP revenues. The assumed risk for the REP will be declining in investment effort and investment costs.
Hypothesis 4.- In the case of stage financing, REP investment will increase in conditional stages by the CF principal. Stage funds are increasing as REP risk is decreasing in the stages. For the CF, the reduced risk from the investment project B t 𝑔 𝑡 𝑛 𝑖𝑡 , will mean higher return E ( 𝜋∗ 𝑡 ), than full financing E ( 𝜋 𝑡 ). Repayment directly depends on finance (and investment) effort.
Empirical framework for a workable case
Since around 2010, renewable energy efforts have increased mainly due to the abatement of the weighted average cost of capital (WACC), additional to REP and CF project risk. According to IRENA (2018), one weight that is acceptable is a 7.5% for OECD countries while the WACC could easily reach around 10% for the rest of the world, without considering exchange rate volatility.
Now, taking IRENA’s global calculation of the various emerging renewable technologies and their average costs, they range for 2017, from around US$2,000 for large PV-solar, to US$3,700 for small (below .5 MW) per kW. For wind projects, average levelized cost ranges from US$1,200 to US$1,700 per kW. For combined cycle investment (CC-gas projects), it is around US$1,000 per kW, while for hydropower ranges from US$1,000 to US$3,500 per kW. As can be seen, renewables have become rather competitive in installation costs, and cannot be seen as too expensive. Moreover, energy efficiency indexes have increased to around 20% - even 40% which avoids one main criticism to renewable projects.
Given the above cost of capital and installations, or CAPEX, the OPEX in 2017, according to the firm Lazard (2017), before subsidies and tax credits, wind comes as the cheapest with operating costs of between US$30-60 per MWh, then comes large solar-PV OPEX at around US$43-53 /MWh, while combined cycle, or CC costs range from US$42 to US$78 / MWh, while coal is at least at the level of US$ 60 /MWh (Lazard 2017). Figures for latest 2021 are not readily available due to economic disruptions arising from the world COVID-19 pandemic. However, one can check the abatement of costs in renewables for 2021 to be around 35%. Most small REP projects range from around USD$ 70,000 to about USD$ 500,000 overall in 2015 (Zheng et a. 2015).
Main risks of renewables, as has been stressed in the present research have to do first with the intermittency of REP that increase financial risks; the size of RE projects, that could stay small and not attaining minimum efficient scale to be partially funded, mainly by non-banks. The most important sources of risk for REP to enter the market seem to arise from incumbent utilities with high market power that could discriminate against or even negate interconnection against renewable projects, mainly if the wholesale market participant is weak. Then another source is the wholesale price w, w* and w**. Hence, small project funding ones, as crowdfunding and other competing sources (ex. green bonds), can be justified.
Additionally, another source of risk comes from regulatory failure, meaning that the regulator fails to provide predictable and clear regulatory instruments to promote the expansion of markets and investments (Ibarra-Yunez 2017). The above has been evidenced more starkly by Mexico’s central government decisions that have derailed renewable economic incentives (not modeled in the present analysis but could change in future administrations).
One needs to note that from the pure cost comparisons there seems that REP is not at a disadvantage, except that the upfront CAPEX poses a time asymmetry for the project risks (CAPEX is somewhat higher in REP than fossil sources, but with much lower OPEX than traditional fossil sources). According to IRENA (2019), the global weighted average cost of electricity from onshore wind, fell 23% between 2010 and 2017 to around US$40 /MWh, mainly driven by turbine cost declines.
Recent auctions have occurred in many countries such as Canada, Germany, the US, and Poland among developed economies, and in Brazil, Chile, Mexico (until 2019), Morocco, and Saudi-Arabia, among developing ones. Auctions seem to become a well-regarded means to promote REP uptake, mainly for the following reasons: a) they attract investors; b) leveling the competitive field if regulation is transparent and purposeful; c) triggering asymmetric pro-market regulation in those market parts that are not natural monopolies; and d) auctions have lowered the offered costs.
A case can be built with experiences between developed and developing examples and hurdles. Noteworthy is that onshore wind power LCOEs were as low as US$0.03/ kWh, with average capacity factors reaching the mentioned 30% by 2018, both in developed but mostly in developing economies (IRENA 2018). With the above framework, one can simulate REP as an ongoing research exercise in a future research effort.
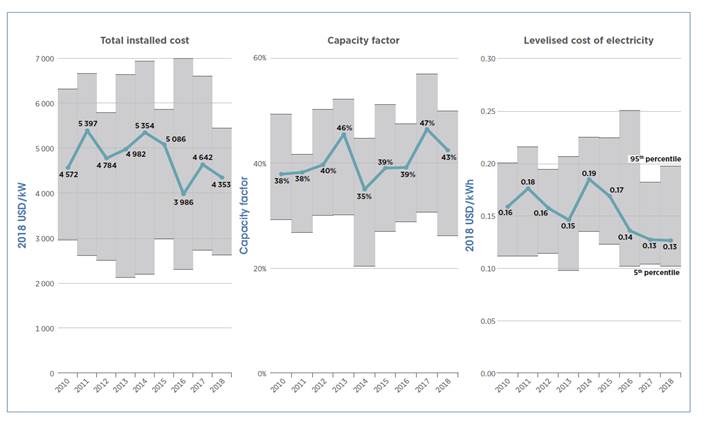
To conclude the present section, the next figures exemplify the cost reduction of renewable energy by technology, the global average size of capacity and energy installations, capital costs, and renewable uptake comparisons.
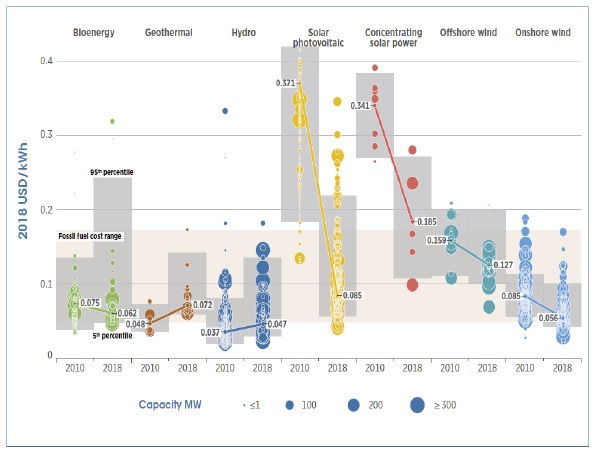
Note: This is for the year of commissioning. The diameter of the circle represents the size of the project, with its centre the value for the cost of each project on the Y axis. The thick lines are the global weighted-average LCOE value for plants commissioned in each year. Real weighted average cost of capital (WACC) is 7.5% for OECD countries and China and 10% for the rest of the world. The single band represents the fossil fuel-fired power generation cost range, while the bands for each technology and year represent the 5th an 95th percentile bands for renewable projects.
Source: IRENA. 2020. Data file renewable power generation costs.
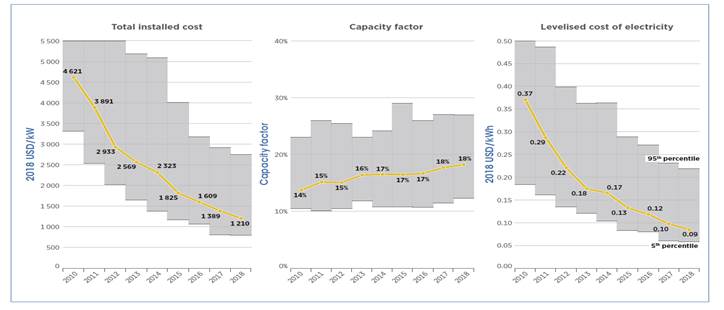
Note: Solar PV, unlike all other technologies in this report have their cost expressed per kilowatt direct current (DC) and their capacity factors are expressed as an AC-to-DC value.
Figure S.5 Global weighted average total installed costs, capacity factors and LCOE for solar PV.
Conclusions
The present article analyzes the main financing vehicles funding renewable energy projects, mainly considering the risks involved, the specific and intensive capital needs and the institutional barriers. Emerging economies also provide different ecosystems that increase the risks perceived and impact investor’s perspectives, as sources of finance and renewable projects face differences with developed economies.
A game theoretical model is presented capturing the financing process between a private capital investor (Crowdfunding CF), an electricity utility, and the renewable energy project owner (REP) from a group of funding options: no funding, full funding or stage (conditional) financing. Equilibria and outflows are modeled per scenario and analyzed considering all the players.
Finally, an analysis of a future workable case is provided in order to identify the future applications and research paths to be followed to increase the existing literature in the matter of innovate financing mechanisms for clean energy deployment in emerging economies. No sufficient data can be found, but a research set of hypotheses grants the treatment of the research effort. Limitations to be addressed in future research, that are not addressed here, are a) risk behaves in a static manner with a normal probability distribution that can be freed, and financing volatility modeled with other distributions; b) the REP in the present paper is not restricted to seek funding under less than minimum efficient scale. Integrating small projects and large projects (such as ones below 1MW capacity and above 1MW capacity), established by many (Mexico’s) regulations to make projects obliged to sell in the wholesale market; c) for lack of readily available data sources, the present research presents in the last section, a brief description of cost reductions by technology, average global investment costs of installations and power flow costs (in US$/MWh), as an indicative insertion to data sources. A further study could use some aggregate but also micro-level data for a quantitative analysis of the subject under study.
All in all, however, the present research project contributes to the project financing literature and understanding of renewable project uptakes and their main hurdles in today’s world.

