


 nueva página del texto (beta)
 Inglés (pdf)
 Artículo en XML
 Referencias del artículo
 Enviar artículo por email
 Citado por SciELO
  Similares en
SciELO
Similares en
SciELO 
 Permalink
1. Introduction
Event-driven architecture (EDA) emerges as a promising architecture for the development of distributed systems, with promising gains in modularization, scalability, and concurrency (Cao et al., 2020; Fiege et al., 2002). For this reason, platforms have emerged to support the event-driven architecture, usually proposing a series of components that communicate through events. Kafka1 is an example of these platforms. It composes services not by chains of commands and queries, but by event flows (Stopford, 2018). This allows each component to perform its tasks independently, as they are triggered by events that represent some business fact or important domain for the application (Tragatschnig & Zdun, 2015). Thus, there is a separation between the execution of services (components) and the communication between them, it becomes easier to perform interactions between heterogeneous components in complex systems (Rahmani et al., 2021). The literature argues that this separation provides greater flexibility to evolve and enhances the scalability of applications (Cao et al., 2020; Fiege et al., 2002; Schipor et al., 2019). On the other hand, in request/response-based applications, data is obtained from different sources, for example, via HTTP requests, which can generate possible congestion (Fiege et al., 2002).
The current literature (Cao et al., 2020; Stopford, 2018) points out that event-driven architecture promotes loose coupling - essential for the modularization of application services - but can increase design complexity and system understanding (Fiege et al., 2002). Among the traditional architectures for implementing service-oriented systems, the REST architectural style stands out (Fielding, 2000). Studies in literature (Laigner et al., 2020) point out the possible benefits of event-driven architecture. Laigner et al. (2020) report an empirical study in which the adoption of EDA was found to improve maintenance and fault isolation in a system that was refactored after years of evolving giving rise to large, complex codes and obsolete, requiring a costly maintenance process. EDA is often adopted in applications for handling a high volume of data in continuous streams (Fertier et al., 2020; Rahmani et al., 2021). The literature on event-driven architecture advocates that designing applications strongly based on events favors the modularization of functionality as well as facilitating maintenance activities and service evolution of applications (Cao et al., 2020). In this sense, designing software adopting EDA may imply a more systematic way to promote a better modularization of software. It is conjectured that the use of EDA will generate applications with greater separation of concerns and cohesion, as well as less coupling, complexity, and size.
However, there is little evidence to confirm whether this expectation is confirmed or not. Today, the literature lacks exploratory studies that investigate the effects of EDA on aspects of software modularity. Furthermore, it is not known whether these effects are better or worse than those caused by traditional architecture. Consequently, developers end up adopting EDA without any empirical evidence about its effects on the modularity of software.
In this article, we present an exploratory empirical study that compares the event-driven architecture and REST architectural style in terms of software modularity. This is an initial study through which we seek to comparatively understand the effects of EDA in different facets of modularization, including separation of concerns, cohesion, coupling, complexity, and size. The effects of EDA are investigated through a case study with 5 evolution scenarios, in which functionalities are added to an application developed using EDA and the REST architectural style. The generated versions were compared using 10 metrics. The results reported are the first to report the potential advantages of the event-driven architecture in terms of software modularity. In this sense, this article can be seen as the first step in a more ambitious agenda to assess the benefits of event-driven architecture empirically. Initial results suggest that the event-driven architecture improved the separation of concerns, but was overcome considering the metrics of coupling, cohesion, complexity, and size. Such results can benefit software developers and architects in choosing the architecture to be adopted, as well as researchers by providing initial findings that point to future research directions.
The study is divided according to the following structure. Section 2 introduces the main concepts for understanding the proposed study. Section 3 addresses related works, exploring the selection process used and comparing them with the present one. Section 4 describes the methodology for developing the study. Section 5 brings the results obtained. Finally, Section 6 draws some conclusions and future work.
2. Background
2.1. Modularization of interests
Modularization is considered essential in the design of modern software (Sant’Anna, 2008). It is defined by the IEEE as the degree to which a system program is composed of discrete components, such that a change in one component has minimal impact on others (Sant’Anna, 2008). While interest is any important property or area of interest of a system that we want to address in a modular way (Sant’Anna, 2008). Therefore, a software interest can be a feature, business rule, non-functional requirement, an architectural pattern, or design pattern (Sant’Anna, 2008).
Software with a high degree of modularization brings several benefits such as comprehension, extensibility, adaptability, and reuse, among others (Parnas, 1972). Consequently, modularization can be applied in various stages of design, ranging from the architecture specification to the detailing of the design and (Sant’Anna, 2008) code abstraction levels. The main objective of the software architecture is to define which components the system should consist of, how these components will communicate with each other, and how they should be deployed to fulfill the requirements (Falatiuk et al., 2019). Therefore, the architecture of software plays an important role in the formulation and development of software (Gardazi & Shahid, 2009).
However, architectural decomposition is still a major bottleneck for the design process of software according to Sant’Anna (2008) , mainly due to the need for simultaneous modularization of a series of broad-scope issues. Consequently, the inadequate modularization of interests can generate complexity in the design of the software. The evaluation of different architectures requires techniques to quantitatively measure (Sant’Anna, 2008), so software metrics are powerful indicators of modularization in the design of software (Sant’Anna, 2008). Therefore, the community has consistently used notions of module coupling, cohesion, and interface size to measure modularization (Sant’Anna, 2008). Therefore, in this study, a set of metrics addressed in Section 4.2 was defined.
2.2. Event-driven architecture
In event-based architecture, components only publish data without knowing the other components or who will consume and react to the data, promoting the separation of computation and event publishing from any subsequent processing (Fiege et al., 2002). Furthermore, their communication is asynchronous in the producer/consumer model, and both are independent of each other (Falatiuk et al., 2019). Consequently, promoting loose coupling between components is why event-driven architecture has become predominant in large-scale distributed applications (Fiege et al., 2002).
The messaging system allows the building of loosely coupled services, as it moves the raw data to a highly coupled location (the producer) and places it in a loosely coupled location (the consumer) (Stopford, 2018). Therefore, any operations that need to be performed on this data are not done by the producer, but by each consumer (Stopford, 2018). That is, services can easily be added to the system in plug and play (pluggable) mode, where they connect to event streams and run when their criteria are met (Stopford, 2018). It not only promotes loose coupling but also manages to store events and data, dispensing with the use of a database, and keeping events “close” to the services (Stopford, 2018). In addition, all events are stored in the order they arrived, allowing events to be played back in order. As a result, the performance of event-based applications is also better, ensuring stability and high performance for high data flow (Stopford, 2018).
2.3. REST architectural style
Among the traditional architectural styles, the REST style stands out in the synchronous request/response model (Fielding, 2000). In the synchronous model, the client makes a request and waits for the response, while it is being processed by the responsible service, so it is widely used in distributed applications (Zhou et al., 2014). Unlike event-driven architecture, adding new services in traditional architecture generally implies introducing a new method and calling the services (Stopford, 2018). However, traditional architecture has some considerable advantages such as simplicity to implement data (or state) residing in one place and centralized control (Stopford, 2018). Thus, in this study, the main point of comparison between REST and EDA will be modularization.
3. Related works
The selection of related works was carried out following two steps: (1) search in digital repositories, such as Google Scholar and Scopus (Elsevier) for articles related to EDA, REST, or empirical studies on modularization; and (2) filter of selected articles considering the alignment of such works with the objective of the work and the formulated research questions (Section 4.1). After selecting the works, they were analyzed (Section 3.1) and compared (Section 3.2) to identify research opportunities.
3.1. Analysis of related works
Laigner et al. (2020) . This study explores the changes from a legacy big data system (BDS) to an event-driven architecture based on microservices. Such BDS is located at the Tecgraf Institute of PUC-Rio, which provides solutions for industrial partners. One of the solutions developed for a client in the oil and gas sector in 2008, concerns a BDS that monitors moving objects and proactively detects events that generate risks to the operation, such as deviations from the route of vehicles. Motivated by the difficult process of maintaining the system and the advent of a new partner, a complete rewrite of the legacy BDS was designed for the current big data technologies. In conclusion, support for microservices for easier maintenance and fault isolation was seen as a benefit. However, the complex data flow generated by the number of microservices, as well as a myriad of technologies, has drawbacks.
Schipor et al. (2019) . It introduces Euphoria, which is a new software in event-driven architecture, aimed at intelligent environments. Composed of a considerable range of heterogeneous devices, each with its operating system, communication protocols, and form of interaction, among others. Such environments have some design criteria such as modularity, scalability, and asynchronicity to produce, process, and transmit messages and events. Therefore, Euphoria was designed by adopting various techniques and quality properties following the (SQuaRE) ISO/IEC 25000 standards. In addition, a technical evaluation was conducted on the capabilities of Euphoria, message size, different devices, and environment complexity (number of devices) were quantified. Its result was satisfactory, achieving a low response time even in an environment composed of many producers and consumers.
Falatiuk et al. (2019) . They present a qualitative study, describing the main architectural concepts and selection of technologies for implementing a document management system, the e-archive. For this, the event-driven architecture, based on microservices, was chosen according to the requirements raised. Therefore, the advantages found were horizontal scalability, modularization, loss of coupling between components, ease of modification, and manipulation of large amounts of data. However, it requires more knowledge of cloud architecture patterns and DevOps culture to ensure scalability and proper monitoring. Thus, the design proves to be quite costly to start with but offers cheaper future maintenance, modifications, and updates as the system evolves.
Alaasam et al. (2019) . It proposes a case study on the feasibility of using the Apache Kafka Stream API (Kafka stream DSL) in the development of Digital Twin. A real-time data stream processing system capable of monitoring, controlling, and predicting states from data collected from various sensors. In it, a parametric study of latency and response time was performed, considering fault tolerance, scalability, and ease of implementation. In conclusion, Kafka proved to be adequate for the proposed system, providing good state management and acceptable latency. However, a loss in efficiency was noticed, while there is a lot of data traffic between the intermediate topics.
Figueiredo et al. (2008) . It presents a quantitative study, comparing aspect-oriented (AO) and object-oriented (OO) programming on two Software Product Lines (SPLs), to evaluate various aspects of the design stability, considering metrics such as Separation of Concerns (SoC), coupling, and cohesion. The SPLs were implemented using AO and OO for comparison purposes, seeking to understand the benefits of AO in software quality issues. The article reports the benefits of an aspect-oriented architecture of SPLs.
Garcia et al. (2006) . They present a quantitative study, comparing Java and AspectJ implementations of the Gang-of-Four (GoF) design patterns. For this purpose, object-oriented programming (OO) and aspect-oriented programming (AOP) were used. To compare applications, using metrics to measure the coupling of objects and the SoC, but also cohesion and size. Considering the characteristics of the implementations in each pattern. After each change, the metrics were collected, always comparing them with the previous version, before the changes. Finally, it reports on which point AOP stood out positively and negatively compared to OO.
Fiege et al. (2002) . It presents a qualitative study on the modular design and implementation of an event system, capable of supporting event scopes and mappings. Among the concepts, the role of the producer and consumer, forms of communication between them, and triggers between events are specified. Some benefits can be mentioned, e.g., system modularization, loose coupling, abstraction, and information hiding. In addition to the components that make up an event-driven architecture, such as the subscribe/unsubscribe of events, necessary to guarantee message distribution. As well as the central point responsible for managing parts of the system, such as passing a trigger to one or more events.
3.2. Comparative analysis of works
Comparison Criteria. Five comparison criteria (CC) were defined to identify the similarities and differences between the proposed work and the selected articles. This comparison seeks to help identify research opportunities using objective rather than subjective criteria. The criteria are described below:
Empirical Study (CC1): studies that performed experimental studies, especially through case studies, experiments, or observations for data collection in the field.
Modularization Analysis (CC2): studies that performed quantitative or qualitative analysis on software modularization.
Event-driven architecture (CC3): studies that address concepts or apply event-driven architecture.
Microservice architecture (CC4): studies that used microservices and/or REST.
Application context (CC5): studies that explore applications in the industry context.
Research opportunities. Table 1 presents the comparison of the selected studies, highlighting the similarities and differences between them. It is observed that only the proposed work meets all defined comparison criteria. In this sense, two research opportunities were identified: (1) the absence of exploratory empirical studies that report empirical evidence on event-driven architecture and REST, in the context of industrial applications; and (2) the lack of studies that comparatively explore the impact of application modularization, using event-driven architecture and the REST style. The next section presents a research methodology to explore these identified opportunities.
Table 1 Comparative analysis of selected related works.
| Related Work | Comparison Criteria | ||||
|---|---|---|---|---|---|
| CC1 | CC2 | CC3 | CC4 | CC5 | |
| Proposed work |

|
|
|
|
|
| Laigner et al. (2020) |
|

|
|
|
|
| Schipor et al. (2019) |
|
|
|
|
|
| Falatiuk et al. (2019) |
|
|
|
|
|
| Alaasam et al. (2019) |
|
|
|
|
|
| Figueiredo et al. (2008) |
|
|
|
|
|
| Garcia et al. (2006) |
|
|
|
|
|
| Fiege et al. (2002) |
|
|
|
|
|
Legend:
Attends  Does not attend
4. Methodology
This section describes the methodology followed to carry out the empirical study. Section 4.1 presents the objective of the study and the research question investigated. Section 4.2 describes the metrics used. Section 4.3 details the experimental process followed, describing the study phases and the activities performed. Section 4.4 brings the data analysis procedures. Section 4.5 describes the chosen target application, detailing its functionalities and characteristics. Section 4.6 details the target application evolution scenarios. Finally, Section 4.7 reveals details regarding the implementation of the analyzed applications.
4.1. Objective and research question
This study aims to compare the event-driven architecture and the REST architectural style in terms of software modularity. We seek to investigate the effects on five different variables involved with modularity (Figueiredo et al., 2008): separation of concerns (SoC), coupling, complexity, cohesion, and size. These effects are investigated in a case study of a target application, which uses EDA and implements another with the same functionalities using the MVC architecture, representing the REST. The two implementations generated were necessary to make the comparison possible. The objective of this study is formulated based on the GQM (Wohlin et al., 2012) model as follows:
Analyze architectural styles
with the purpose of investigating its effects
in relation to the software modularity
from the perspective of developers
in the context of the evolution of a realistic application.
In particular, the study explores the effects of event-driven architecture on the modularity of software during the evolution of software through the addition of new features. In this sense, a research question (QP) was formulated:
QP: Does event-driven architecture promote a greater modularization when compared to the REST architectural style?
Parnas (1972) points out that, if the modularization of an application is high, some benefits will be obtained, such as greater ease of change, greater adaptability, and code understanding. In addition, modularization can provide module separation, allowing for parallel development, reduced development time, and better change impact management (Almentero et al., 2014). Parnas (1972) reinforces that a module can be defined as a set of design decisions independent of other modules and the interaction between modules must be entirely through their interfaces (Parnas, 1972) - thus promoting the separation of interests and delegating isolated functions to each module. Therefore, the precise separation of the application’s interests leads to modularization, allowing its use in different contexts. In addition, modularization allows the developer to focus on one module at a time, making it easier to understand, and then combine them all and understand the application (Almentero et al., 2014). Event-driven architecture (Schipor et al., 2019; Stopford, 2018) tries to contemplate such benefits cited, highlighting the importance of carrying out an empirical study to verify the benefits of this new architectural style.
4.2. Metrics
Table 2 presents the metrics used to quantify the five modularity variables, including separation of concerns (SoC), coupling, cohesion, complexity, and size. Such metrics were used because previous empirical studies (Figueiredo et al., 2008; Garcia et al., 2006) have already shown their validity in investigations on software modularity.
Table 2 Set of metrics used in the study (source (Garcia et al., 2006)).
| Variable | Metric | Description |
|---|---|---|
| Separation of concerns (SoC) | Concern Diffusion over components (CDC) | It counts the number of classes whose main purpose is to contribute to the scenario implementation and the number of classes that access them. |
| Concern Diffusion over components (CDC) | Counts the number of methods whose purpose is to contribute to the scenario implementation and the number of methods that access them. | |
| Concern Diffusion over operations (CDO) | Counts the number of transition points for scenario implementation in the lines of code. Transition points are points in the code where there is a "change of concern". | |
| Coupling | Coupling between components (Dep_Out) | Number of dependencies where the module is a client. |
| Coupling between components (Dep_In) | Number of dependencies where the module is a supplier. | |
| Cohesion | Relational cohesion (H) | Measures the average number of internal relationships per class/interface. It is calculated as the ratio of R+1 to the number of classes and interfaces per package. |
| Complexity | Number of relationships (R) | Measures the number of relationships between classes and interfaces per package. |
| Size | Lines of code (LOC) | It counts the lines of code whose purpose is to contribute to the implementation of the scenario. |
| Number of attributes (NumAttr) | Counts the number of attributes whose purpose is to contribute to the implementation of the scenario. | |
| Weighted operations per component (NumOps) | Counts the number of operations whose objective is to contribute to the implementation of the scenario. |
Separation of concerns. In this study, this set of metrics seeks to measure the degree of modularization of the functionalities implemented using the event-driven architecture and the REST style. The SoC will use three metrics: (i) components (or classes) based on Concern Diffusion over components (CDC), (ii) operations (or functions) based on Concern Diffusion over operations (CDO), and (iii) lines of code based on the Concern Diffusion over Lines of Code (CDLOC) (Figueiredo et al., 2008; Garcia et al., 2006). These metrics help reveal the degree of spread and intertwining of the features implemented in the modules of the target application. The smaller the number of modules needed to implement a functionality, the smaller its degree of scattering. Moreover, the greater the number of features in each module, the greater the degree of intertwining between them. The SoC metrics were quantified manually (Figueiredo et al., 2008; Garcia et al., 2006) through the manual “shading” of the code that identifies which parts of the source code contribute to the implementation of a certain functionality (Figueiredo et al., 2008).
Coupling. It seeks to quantify, through two metrics Dep_Out and Dep_In, how much the elements of the design (packages, class, and methods) are coupled. The greater the degree of dependence between them, the more elements tend to suffer from unwanted propagation of modifications. Dep_In quantifies the number of classes outside a package that depends on the classes inside that package. Dep_Out quantifies the number of classes within a package that depends on classes outside that package.
Complexity and cohesion. Complexity measures the degree of connectivity between elements per package. Thus, for its calculation, the values of the project packages were added. Nevertheless, cohesion measures the degree to which elements are logically related or “belong to each other”. Consequently, the greater the connectivity between the elements, the greater the cohesion. Like complexity, its values are per package, in this case the values were added and divided by the number of packages. Thus, much that both metrics are somewhat related to size.
Size. Measure the length of the project and application code. Size metrics span different perspectives of the size of the application (Garcia et al., 2006). The set of metrics for size is composed of three metrics: (I) lines of code (LOC), (II) number of attributes (NumAttr) and (III) operations (NumOps). In general, a larger size implies greater complexity (Garcia et al., 2006). LOC counts the lines of code needed in each change, disregarding blank lines or comments, NumAttr captures the number of attributes in each change and NumOps counts the number of operations/functions.
4.3. Experimental process
Figure 1 presents the experimental process adopted, which is formed by three stages, including (1) identification of the target application, (2) implementation and data collection, and (3) analysis of results. Each step is discussed below. It is based on previous empirical studies reported in the current literature (Farias et al., 2014; Farias et al., 2015; Farias, 2016).
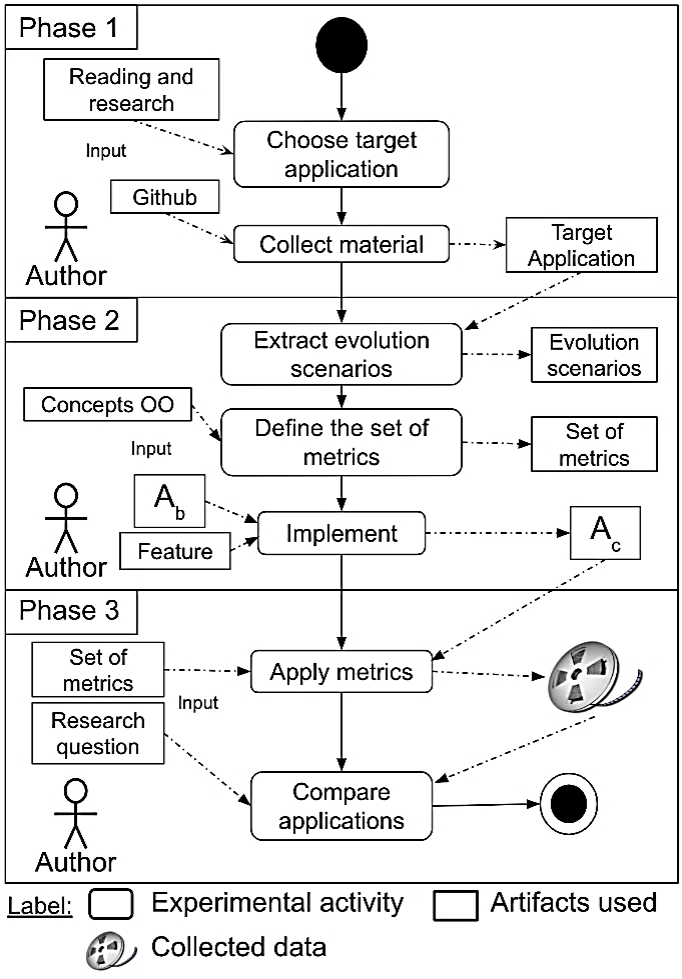
Step 1: Identification of target application. The first step focused on finding a target application, using the event-driven architecture. In this sense, the application described by Stopford (2018) was identified as the target application (described in Section 4.5). This application was developed using best practices, it is a robust application that uses technologies widely spread by industry, such as Apache Kafka. Its source code is available on Github2.
Step 2: Implementation and data collection. The functionalities of the target application were identified and organized in evolution scenarios (described in Section 4.6), in such a way as to allow the implementation of a similar application using the REST architectural style. Note that the features of the target application are well documented (Stopford, 2018). The set of metrics described in Section 4.2 was defined from similar works (Figueiredo et al., 2008; Garcia et al., 2006) and OO concepts. After identifying the features and defining the set of metrics, the application was implemented using the Spring Boot MVC framework and Spring Web. In the implementation, the features were implemented in the application (Ab), resulting in a new version (Ac). Inevitably, as they are different architectures, certain differences and refactoring are expected to align applications with their evolution. The second stage was completed after the implementation of the target application using the REST standard.
Step 3: Analysis of results. After the scenarios are implemented, the metrics are collected. For this, we use the SDMetrics3 tool, which provides support for the collection of most metrics. Using as input the last version developed (Ac), the quantitative data are obtained. From the collected metrics, it was possible to make comparisons between the applications, allowing us to observe their changes. Thus, to aid the analysis, tables will be used to visually identify changes, in addition to classifying the elements by a metric and highlighting the elements by percentages.
4.4. Analysis procedure
Line graphs are used to provide an overview of the data collected in the measurement process. These graphs allow us to analyze the impact of the event-driven architecture on the modularization metrics used (Table 2). Each chart focuses on the data collected on a specific metric. The X-axis specifies evolution scenarios, while the Y-axis presents collected values for a specific metric. To bring an analysis of data distribution, statistical methods were used, including standard deviation, median, and mean. In addition, the difference between the averages was accounted for. The quantitative data analysis will be through the metrics collected by the SDMetrics tool, which automatically counts the metrics Dep_Out, Dep_In, H, R, NumAttr, and NumOps. The separation of concerns metrics (CDC, CDO, and CDLOC) was manually accounted for.
4.5. Application
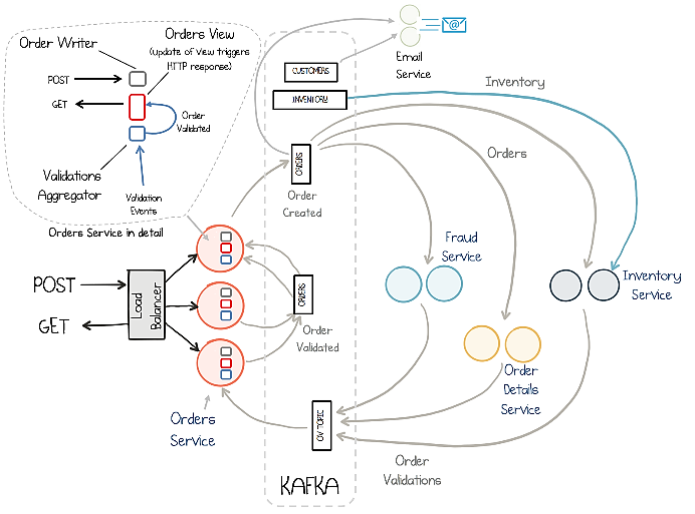
Figure 2 presents a schematic illustration of the target application, which is an order management system composed of several components. The target application used was obtained from an example provided by Confluent (Stopford, 2018). Therefore, the main reasons for their choice were the careful detailing of the application in (Stopford, 2018), the availability of the application, and the adoption of good implementation practices. It can be considered a complex application due to the resources used. The architecture discussed is EDA in conjunction with microservices, in an implementation using the Java language. Kafka is the middleware responsible for managing the application, such as data storage, entity mapping, production, and consumption of events. On the Confluent website, details of the resources used, and the responsibilities of each component are presented, in addition to making the source code of the implementation available in the Github repository4.
4.6. Scenarios of evolution
Table 3 presents the considered functionalities. In total, five scenarios were identified, each containing functionalities related to the target application. Each scenario incorporates a new functionality from the previous version. The order service represents the entry point, a REST interface provides the POST and GET (Stopford, 2018) methods. When performing a POST, it will create an event in the application, which will be consumed by three other validation services: (I) order data validation, (II) fraud identification, and (III) stock reservation. The order will be validated in parallel, issuing pass or fail based on the success of each (Stopford, 2018) validation. As the validations occur in parallel, the result of each one is sent by its topic, separated from the others (Stopford, 2018). Finally, the results are aggregated into the order service where orders are moved to the state of pass or fail, based on the result combination (Stopford, 2017).
Table 3 Description of evolution scenarios.
| Scenario | Description | Operation |
|---|---|---|
| C1 | Order service | Addition |
| C2 | Order validation | Addition |
| C3 | Fraud identification | Addition |
| C4 | Stock reserve | Addition |
| C5 | Sending e-mail to the customer | Addition |
For the user to query any order from GET, a queryable materialized view was created in the order service (“Orders view” in Figure 2), using a state store in each instance of the service, so that any request can be historically requested (Stopford, 2018). The validations are divided into:
(1)Order data: checks the basic elements, such as quantity and price of the order itself.
(2)Fraud identification: tracks the total value of each customer’s orders in a one-hour window, alerting if the limit that configures a fraud is reached.
(3)Stock reservation: checks if there are units available to fulfill the order, if possible, will reserve the requested quantity for the time necessary until the payment is completed.
The extraction of features took place analyzing the target application, because as mentioned above, it was obtained ready-made. Thus, when reading the application description, the main entry point was observed, responsible for receiving requests and persisting in the database. After persisting the request, three validations work on it to be granted or refused. Finally, after passing on validations, an e-mail will be sent to the customer informing them of the status of the order. Therefore, the functionalities comprise the perceived functionalities.
4.7. Implementations
The implementations were developed by one of the authors, who works as a software developer. The author’s experience is in traditional applications of the REST style. Therefore, for the development of the event-driven application, qualification through courses and tutorials was necessary. In which the installation, launch of services, basic concepts, as well as their main features were discussed. The versioning of implementations was aided by Git in the GitHub service. This made it possible to separate each implemented scenario into a tag, a resource where we defined checkpoints on the scenarios.
The implementation of the event-driven application followed the existing code. Being added only what was necessary to achieve the functionality goal, because of that test, for example, were discarded. For the execution of this application, scripts were also implemented, due to the difficulty found in executing the services and initializing the storage structures, however the metrics were not applied to them. As the application follows the concept of microservices, each functionality is separate, a fact that facilitated the implementation. A certain pattern was noticed in most scenarios, where it was necessary to "register" the Topic of the functionality in a utils, create the types in Avro, and then add the class that supports the functionality. Despite the application being ready, there was some effort to understand its functioning and even the application’s execution, as it was made possible by scripts.
The implementation in the MVC architecture, which represents the REST style, was fully implemented by the author. To aid in the implementation, the Spring Boot MVC framework was adopted, considering its popularity. As this is a traditional application, a database (SQL) for storage Postgres was used. This application was developed to perform the same features as the other, following what a traditional application would do and in the simplest way possible. In this one, several differences with the event-driven architecture are observed, such as validations, implemented in separate classes, but they need calls to the service that receives the requests, a behavior that seeks to be avoided when seeking separation of concerns. Compared to the event-driven version, less effort was perceived even if it was implemented from scratch, perhaps this is explained by the author’s experience and familiarity with traditional architecture.
5. Results
This section presents the results collected after the execution of the methodology defined in Section 4. Figure 3, Figure 4 and Figure 5 present the results obtained from the implementations. Table 4 and Table 5 bring statistical indicators about the results, including the standard deviation, median, mean and the difference between the means.
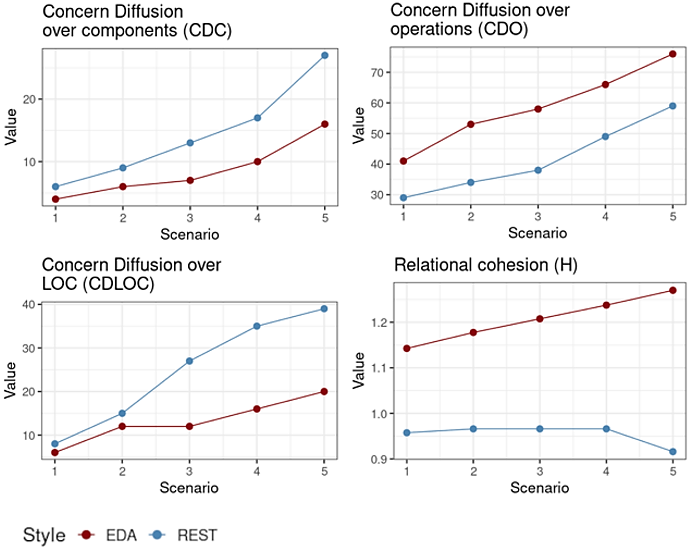
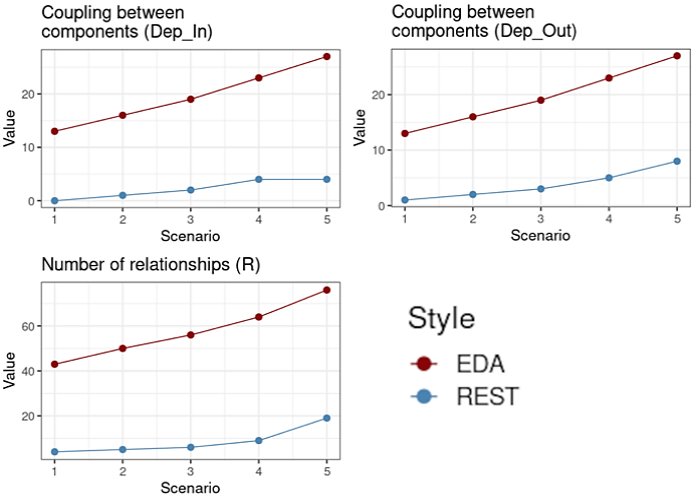
Figure 4 Results collected considering the metrics Dep_In, Dep_Out and R. Observed results 1: The means of separation of concerns of the event-driven architecture in the CDC and CDLOC metrics showed differences of -40.74% and -48.72%, respectively, in addition to lower values in all versions. This highlights the better separation of concerns compared to REST. However, the coupling means represented by the Dep_out and Dep_in metrics show differences of +237.50% and +575%, respectively. This shows that dependencies, both internal and external, are greater in the event-driven architecture.

Figure 5. Results collected considering LOC, NumAttr and NumOps metrics. Observed results 2: The averages of cohesion, complexity and size favored the REST, highlighting the metrics R, LOC and NumAttr with differences of +572.09%, +76.52% and +70.37%, respectively. Gains above 50% were motivated by the need for auxiliary classes and functions/attributes to enable the functioning of each service in the event-driven architecture. On the other hand, the average cohesion (H) favored the event-driven architecture by 26.48%, showing an increase in the average number of internal relationships per class/interface.
Table 4 Results obtained in SoC and coupling.
| Variable | Metric | Style | SD | Mdn | Avg. | Difference |
|---|---|---|---|---|---|---|
| SoC | CDC | EDA | 1.72 | 3 | 3.2 | -40.74% |
| REST | 2.50 | 4 | 5.4 | |||
| CDO | EDA | 13.11 | 10 | 15.2 | +28.81% | |
| REST | 9.02 | 10 | 11.8 | |||
| CDLOC | EDA | 2.19 | 4 | 4 | -48.71% | |
| REST | 2.56 | 8 | 7.8 | |||
| Coupling | Dep_Out | EDA | 3.83 | 4 | 5.4 | +237.5% |
| REST | 0.80 | 1 | 1.6 | |||
| Dep_In | EDA | 3.83 | 4 | 5.4 | +575% | |
| REST | 0.75 | 1 | 0.8 |
Table 5 Results obtained in cohesion, complexity and size.
| Variable | Metric | Style | SD | Mdn | Avg. | Difference |
|---|---|---|---|---|---|---|
| Cohesion | H | EDA | 0.04 | 1.20 | 1.20 | +26.48% |
| REST | 0.02 | 0.96 | 0.95 | |||
| Complexity | R | EDA | 11.43 | 56 | 57.8 | +572.09% |
| REST | 5.46 | 6 | 8.6 | |||
| Size | LOC | EDA | 116.17 | 174 | 233 | +76.52% |
| REST | 93.11 | 100 | 132 | |||
| NumAttr | EDA | 4.83 | 8 | 9.2 | +70.37% | |
| REST | 3.50 | 4 | 5.4 | |||
| NumOps | EDA | 13.50 | 10 | 15.4 | +14.93% | |
| REST | 8.73 | 11 | 13.4 |
5.1. Separation of concerns and coupling
Table 4 shows the results of the effects of event-driven architecture (EDA) on the separation of concerns through the perspective of three metrics: CDC, CDO and CDLOC. EDA presented lower results compared to REST style, considering the CDC and CDLOC metrics. This can be seen through the differences between the computed means -40.74% and -48.72%, respectively. This result indicates that fewer classes (CDC) are affected in each evolution scenario, as the services are independent but share auxiliary classes (utils). Smaller numbers are also observed in the amount of interest transitions under the lines (CDLOC). This means that EDA promoted a better modularization of concerns considering components and lines of code. In Figure 3, it is observed that both metrics presented lower values for EDA. However, the EDA presented superior results for the CDO metric, having a difference between the means of 28.81%. The CDO median, in turn, did not show any difference. In most scenarios more operations (or functions) were needed to implement the service of each scenario in the EDA. In Table 4, it is observed that only in scenario 4, the MVC presented a higher value. Therefore, this result influenced the CDO metric.
Considering the coupling variables of Table 4, it is observed that the REST presents less coupling than the event-driven architecture. Both Dep_out and Dep_in metrics show differences between the computed averages of 237.50% and 575%, respectively. When analyzing Figure 4, it is clear that from the first scenario, EDA presents higher values. In fact, not only less coupling in REST, but also less variation in each scenario.
The best separation of concerns is in line with the feature of microservices (Falatiuk et al., 2019; Laigner et al., 2020), where each service is independent. This promotes greater modularization of the application, which benefits in scenarios where there are changes in the behavior or evolution of the application, such as the addition of new features (Sant’Anna, 2008). Furthermore, it is beneficial to the performance of the (Subramanian et al., 2007) project. However, service independence requires additional structure, resulting in more functions, attributes, and auxiliary classes. The tighter coupling in the event-driven architecture can be explained by the need for indispensable auxiliary classes to avoid code duplication, since the functions serve different contexts. Without such classes, there would be more code in the services, increasing complexity.
5.2. Complexity, cohesion and size
Table 5 provides the results of the effects of event-driven architecture (EDA) in relation to complexity, cohesion, and size across evolutionary scenarios. The results show that EDA obtained higher results compared to REST, observing the complexity and cohesion variables computed through the H and R metrics, respectively. The numbers obtained show that the differences between the computed means of the H and R metrics were 26.48% and 572.09%, respectively. Although the results of relational cohesion (H) have favored EDA, complexity must be a factor to be evaluated.
Analyzing the results from the perspective of the size variable, they indicate that the event-driven architecture achieved higher results compared to REST. This finding was quantified using the LOC, NumAttr, and NumOps metrics, the differences between the means of these metrics were 76.52%, 70.37% and 14.93% respectively. On the other hand, analyzing Figure 5, it is observed that the REST in the third scenario presents a considerable increase in the NumOps metric.
After implementation, such results were expected, as the number of lines and operations in the event-driven architecture were quite high, especially in the first scenarios. This can be explained by the fact that in REST a smaller number of elements (classes) are needed to build the application. On the other hand, in the event-driven architecture, it was observed the need to create several auxiliary classes of services (utils), as well as functions and attributes for configurations of each service, both in its initialization and operation. Consequently, this need is reflected in higher values on complexity and cohesion - which are linked to increasing application size without proper management, for example, between the number of relationships between classes and interfaces per package. In short, larger applications also tend to be more complex, and other studies have also found greater complexity in the event-driven architecture (Falatiuk et al., 2019; Laigner et al., 2020).
5.3. Discussion
Event-driven architecture has had good results in separating concerns. On the other hand, when analyzing the results obtained by the set of defined metrics, it was noticed that the REST obtained better results in general. The better separation of concerns allows for a better modularization of functionality, highly recommended when looking to have independent services that avoid concatenation of modifications when they are changed (Sant’Anna, 2008). The results obtained are discussed considering three important characteristics of the event-driven architecture: coordination-free by design, database inside out and stream processing.
Coordination-free by design. Controlling data consistency on systems where data is sent to many different services is a challenge. This implies many copies of the same data in different services, which can cause collisions and inconsistencies if they were writable. A solution to this is to adopt the single writer principle. For example, the order service can control how an order evolves over time (Stopford, 2018). Consequently, each functionality subscribes to the strongly ordered flow, observing from its own temporal point of view.
This creates an important degree of decoupling in the system while services are disconnected. Thus, by centralizing the single writer, it creates a “tunnel” of consistency, validations and other writers through a single stream. As one of the characteristics of the architecture is to move data (or events) while operating on it (Fiege et al., 2002), in Kafka through Kafka Streams and KSQL - central points for processing data in client programs. This composition can be seen in the event-driven application. As the requests are processed by the order service, they immediately trigger the validations that occur in the order. In each validation, the processed event does not suffer changes, because, when passing through the validation, a new event will be created emitting the valid or invalid status. Finally, sending e-mail to the client consumes the new events emitted by the validations. So, the better separation of concerns presented by the event-driven architecture, justified by the design that prioritizes the decoupling of services.
Database inside out. Consists of the idea that a database is composed of a series of components - confirmation, log, query engine, indexes and cache. Instead of putting all these concerns together in a black box technology, like a traditional database, we can separate using stream processing tools and these parts exist in different places, joined by log (Stopford, 2018). The platform plays the role of confirmation log, the Streams are used to create indexes or views, and these views behave as a form of continuously updated cache.
Therefore, the structure described above is beneficial to event-driven architecture, especially in (Stopford, 2018) performance optimization. On the other hand, it also leads to higher costs as, as observed in the event-driven application, the available configurations contribute to the increase in application size. For example, in the main order processing service, there is the configuration of producer and Streams, to support the processing of events, these configurations require attributes and functions directly in the service class. Compared to the REST, which does not need similar configurations, it would notice a considerably larger application from a size perspective thanks to several configurations of the event-driven architecture.
Stream processing. Messaging systems have been used for a long time to exchange events between systems, but only recently have they started to be used in the storage layer. This creates an interesting architectural style. Because, as mentioned earlier, the structure of a database can be descomposed using stream processing (streaming) (Stopford, 2018). Initiating streaming platforms, such as Kafka, which processes the flow of events, store the events in log structure and trigger a cascade of services subscribed to topics. This allows applications and services to embed logic directly into event flows. In addition to making available the database processing resources in the application layer, through an API. Based on a DSL (domain-specific language), which provides a declarative-style interface where streams can be joined, filtered, grouped, or aggregated by (Stopford, 2018). Also, it provides functional styling mechanisms such as map, flat Map, transform, peek, among others (Stopford, 2018). However, the results indicate that data processing in event-driven architecture generates more lines of code, attributes and functions. Taking as an example the second, third, and fourth scenario, where the added features focus on simple SQL queries at REST, on the other hand, in the event-driven architecture, it requires a considerably greater effort, between consuming the events of some topic, applying the logic and creating an event, there are several validation settings and more steps in the consumption of each topic, reflected in the metrics.
5.4. Limitations
The study has some limitations that need to be considered. Only one application was considered in the study, with only scenarios for adding new features. Other applications were found, however, they were not considered due to some restrictions, such as small size, they were not open source, they did not adopt good implementation practices, and they do not have documentation. As argued in the study, event-driven applications show a high complexity, which is also present in development, due to its perceived learning curve. This being one of the reasons why the study only explores one application, developing one, in addition to being unfeasible, could hinder the evaluation of the results. Such difficulty can be understood by the great difference compared to conventional architectures. As explored, the event-driven architecture has no database, events are triggers and a data flow must be built (Stopford, 2018).
6. Conclusions and Future Work
Event-driven architecture has been adopted in the industry and some technologies have been proposed to make them viable, such as Kafka. As an alternative to REST for the implementation of service-oriented systems. This work reported an initial empirical study with the purpose of comparing the event-driven architecture and the REST architectural style, represented by the MVC architecture -through the perspective of separation of concerns, coupling, cohesion, complexity and size - to through 5 scenarios for the evolution of an application.
The event-driven architecture, represented by Kafka, showed good results regarding the separation of concerns. On the other hand, the other metrics did not show better results than REST. Therefore, the application that uses the event-driven architecture, based on microservices, presents a better separation of concerns than the REST application. By providing a better modularity of interest, some characteristics can be affected. Therefore, when adopting event-driven architecture, it is necessary to analyze these advantages and disadvantages pointed out in this study. As future works, it is intended to carry out: (1) increase the number of accounted metrics, aiming to increase the perspective of analysis; (2) consider more applications to replicate the study carried out; and (3) collect more data to enable rigorous statistical analysis. This work can be seen as a first step towards a more robust agenda of experimental studies related to the effects of event-driven architectures on the modularity of software.

